
TORONTO-DOMINION BANK (NYSE:TD) Technical Analysis observations.
By Mill Chart
Last update: Oct 8, 2024
We've identified TORONTO-DOMINION BANK (NYSE:TD) as a potential breakout candidate based on our stock screener's analysis. This breakout setup pattern suggests that after a strong uptrend, the stock is currently consolidating, potentially signaling a continuation of the trend. Keep an eye on NYSE:TD for further developments.
Zooming in on the technicals.
ChartMill assigns a proprietary Technical Rating to each stock. The score is computed daily by evaluating various technical indicators and properties. The score ranges from 0 to 10.
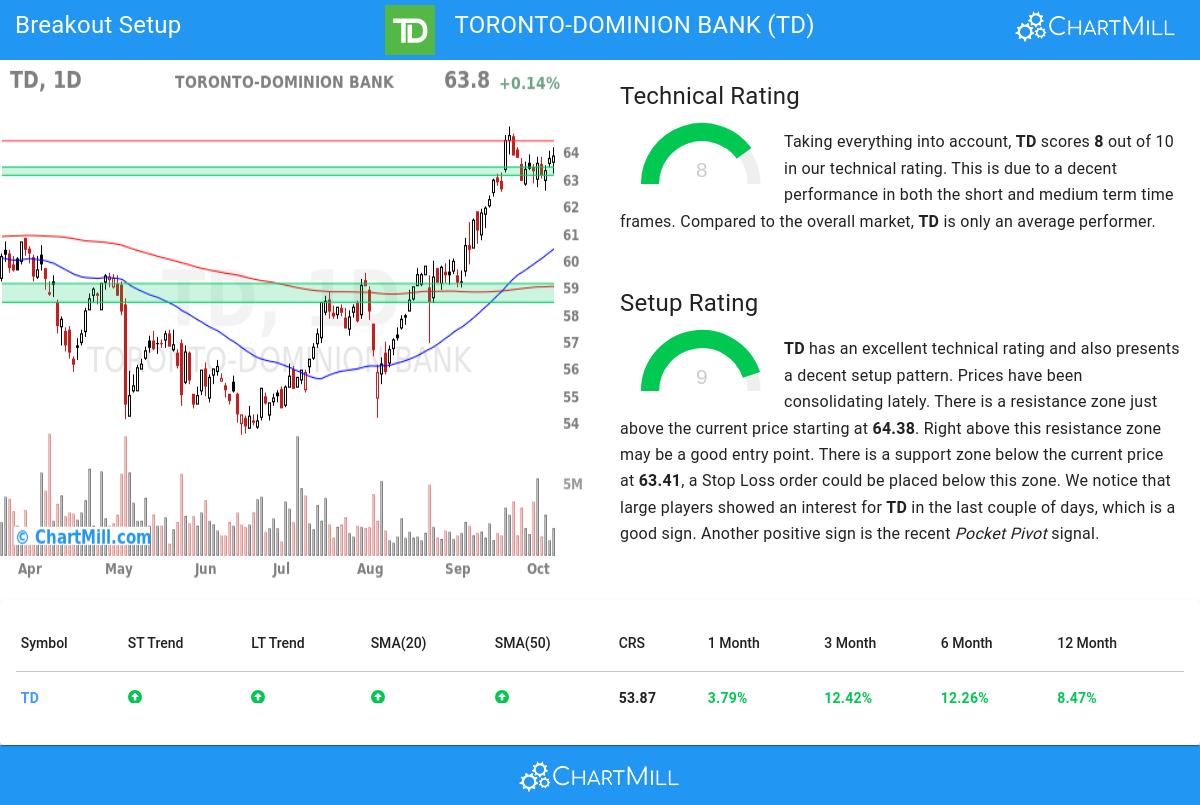
Taking everything into account, TD scores 8 out of 10 in our technical rating. This is due to a decent performance in both the short and medium term time frames. Compared to the overall market, TD is only an average performer.
- The long and short term trends are both positive. This is looking good!
- TD is currently trading in the upper part of its 52 week range. The S&P500 Index however is currently trading near a new high, so TD is lagging the market slightly.
- TD is currently showing a bull flag pattern! A bull flag pattern occurs when prices pull back slightly after a strong rise up. This may be a nice opportunity for an entry.
- When comparing the performance of all stocks over the past year, TD turns out to be only a medium performer in the overall market: it outperformed 53% of all stocks.
For an up to date full technical analysis you can check the technical report of TD
Why is NYSE:TD a setup?
Besides the Technical Rating, ChartMill also assign a Setup Rating to every stock. This setup score also ranges from 0 to 10 and determines to which extend the stock is consolidating. This is achieved by evaluating multiple short term technical indicators. NYSE:TD currently has a 9 as setup rating:
Besides having an excellent technical rating, TD also presents a decent setup pattern. Prices have been consolidating lately. There is a resistance zone just above the current price starting at 64.38. Right above this resistance zone may be a good entry point. There is a support zone below the current price at 63.41, a Stop Loss order could be placed below this zone. We notice that large players showed an interest for TD in the last couple of days, which is a good sign. Another positive sign is the recent Pocket Pivot signal.
Trading breakout setups.
To potentially initiate a trade, it is common practice to wait for the stock to break out of the consolidation zone. This breakout signifies a potential upward movement, and traders may enter the stock at that point. Conversely, if the stock falls back below the consolidation zone, it may be sold at a loss.
Of course, there are many ways to trade or not trade NYSE:TD and this article should in no way be interpreted as trading advice. The article is purely based on an automated technical analysis and just points out the technical observations. Always make your own analysis and trade at your own responsibility.
Our Breakout screener lists more breakout setups and is updated daily.
Disclaimer
This article should in no way be interpreted as advice. The article is based on the observed metrics at the time of writing, but you should always make your own analysis and trade or invest at your own responsibility.