A technical analysis of AT&T INC.
By Mill Chart
Last update: Oct 17, 2024
We've identified AT&T INC (NYSE:T) as a potential breakout candidate based on our stock screener's analysis. This breakout setup pattern suggests that after a strong uptrend, the stock is currently consolidating, potentially signaling a continuation of the trend. Keep an eye on NYSE:T for further developments.
Zooming in on the technicals.
ChartMill employs a sophisticated system to assign a Technical Rating to every stock in its analysis. This rating, which ranges from 0 to 10, is determined by carefully assessing multiple technical indicators and properties.
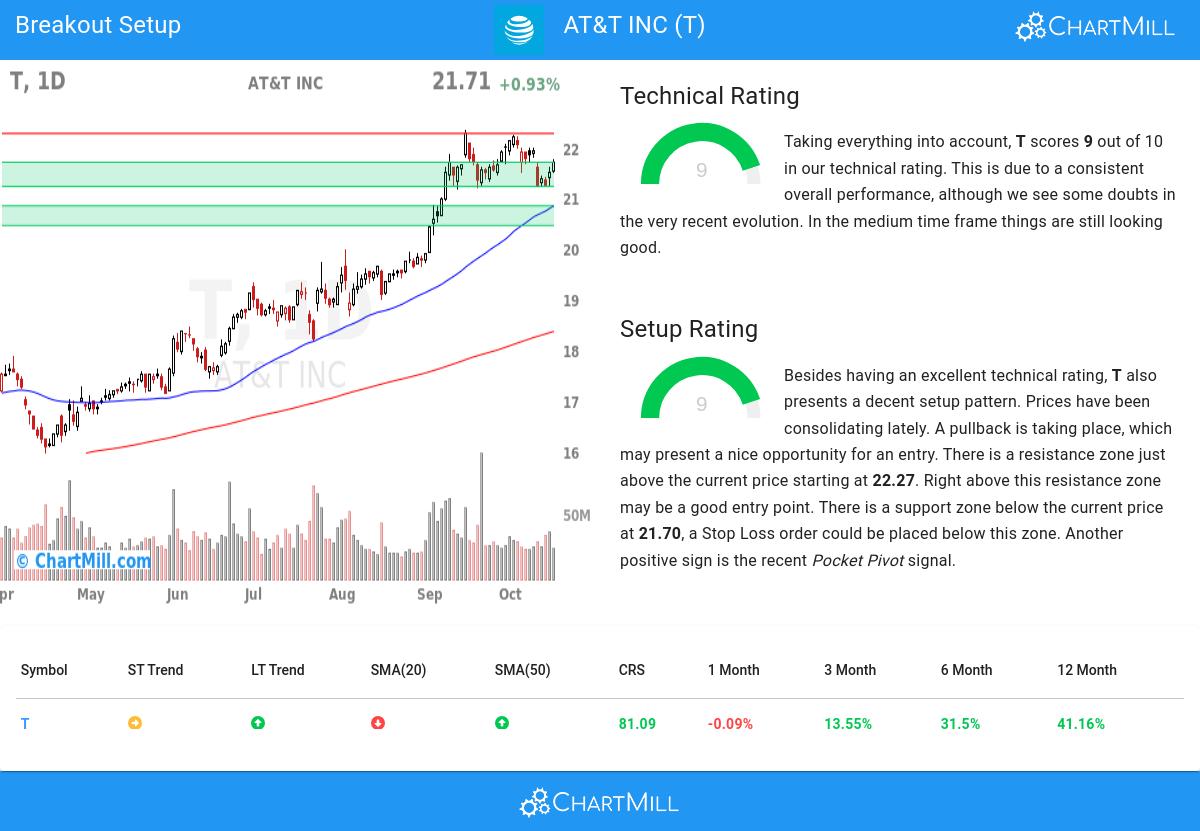
We assign a technical rating of 9 out of 10 to T. This is due to a consistent overall performance, although we see some doubts in the very recent evolution. In the medium time frame things are still looking good.
- The long term trend is positive and the short term trend is neutral. The long term trend may just continue or reversal may be around the corner!
- Looking at the yearly performance, T did better than 81% of all other stocks. On top of that, T also shows a nice and consistent pattern of rising prices.
- T is part of the Diversified Telecommunication Services industry. There are 34 other stocks in this industry. T outperforms 75% of them.
- T is currently trading near its 52 week high, which is a good sign. The S&P500 Index however is also trading near new highs, which makes the performance in line with the market.
- In the last month T has a been trading in a tight range between 21.18 and 22.24.
For an up to date full technical analysis you can check the technical report of T
How does the Setup look for NYSE:T
Alongside the Technical Rating, ChartMill assigns a Setup Rating to evaluate the consolidation level of a stock. This rating, ranging from 0 to 10, is updated daily and considers various short-term technical indicators. The current setup rating for NYSE:T is 9:
T has an excellent technical rating and also presents a decent setup pattern. Prices have been consolidating lately. A pullback is taking place, which may present a nice opportunity for an entry. There is a resistance zone just above the current price starting at 22.27. Right above this resistance zone may be a good entry point. There is a support zone below the current price at 21.70, a Stop Loss order could be placed below this zone. Another positive sign is the recent Pocket Pivot signal.
Trading setups like NYSE:T
To potentially initiate a trade, it is common practice to wait for the stock to break out of the consolidation zone. This breakout signifies a potential upward movement, and traders may enter the stock at that point. Conversely, if the stock falls back below the consolidation zone, it may be sold at a loss.
Important Note: The content of this article is not intended as trading advice. It is essential to perform your own analysis and exercise caution when making trading decisions. The article presents technical observations generated by automated analysis but does not guarantee any trading outcomes. Always trade responsibly and make independent judgments.
Our Breakout screener lists more breakout setups and is updated daily.
Disclaimer
This is not investing advice! The article highlights some of the observations at the time of writing, but you should always make your own analysis and invest based on your own insights.
26.96
+0.63 (+2.39%)
Find more stocks in the Stock Screener
T Latest News and Analysis
 16 hours ago - ChartmillLooking for the most active stocks in the S&P500 index on Tuesday?
Stay informed about the most active stocks in the S&P500 index on Tuesday's session. Discover the stocks that are generating the highest trading volume and driving market activity.
 22 hours ago - ChartmillTop S&P500 movers in Tuesday's pre-market session
Curious about the S&P500 stocks that are showing activity before the opening bell on Tuesday?
2 days ago - ChartmillWhich S&P500 stocks are the most active on Monday?Stay informed about the most active stocks in the S&P500 index on Monday's session. Discover the stocks that are generating the highest trading volume and driving market activity.
 2 days ago - ChartmillTechnical Setup: AT&T INC (NYSE:T) Appears Poised for a Breakout.
Investors are keeping a close eye on AT&T INC (NYSE:T) as it boasts an impressive technical rating of 10 out of 10, signaling a possible breakout.
14 days ago - ChartmillMost active S&P500 stocks in Wednesday's sessionStay informed about the most active stocks in the S&P500 index on Wednesday's session. Discover the stocks that are generating the highest trading volume and driving market activity.
21 days ago - ChartmillThese S&P500 stocks are the most active in today's sessionExplore the S&P500 index on Wednesday and find out which stocks are the most active in today's session. Stay updated with the stocks that are capturing market interest and driving market movements.
