
NASDAQ:SWKS: good value for what you're paying.
By Mill Chart
Last update: Feb 25, 2025
Discover SKYWORKS SOLUTIONS INC (NASDAQ:SWKS)—an undervalued stock our stock screener has picked out. NASDAQ:SWKS demonstrates solid fundamentals, including health and profitability, all while staying attractively priced. Let's explore the details.
ChartMill's Evaluation of Valuation
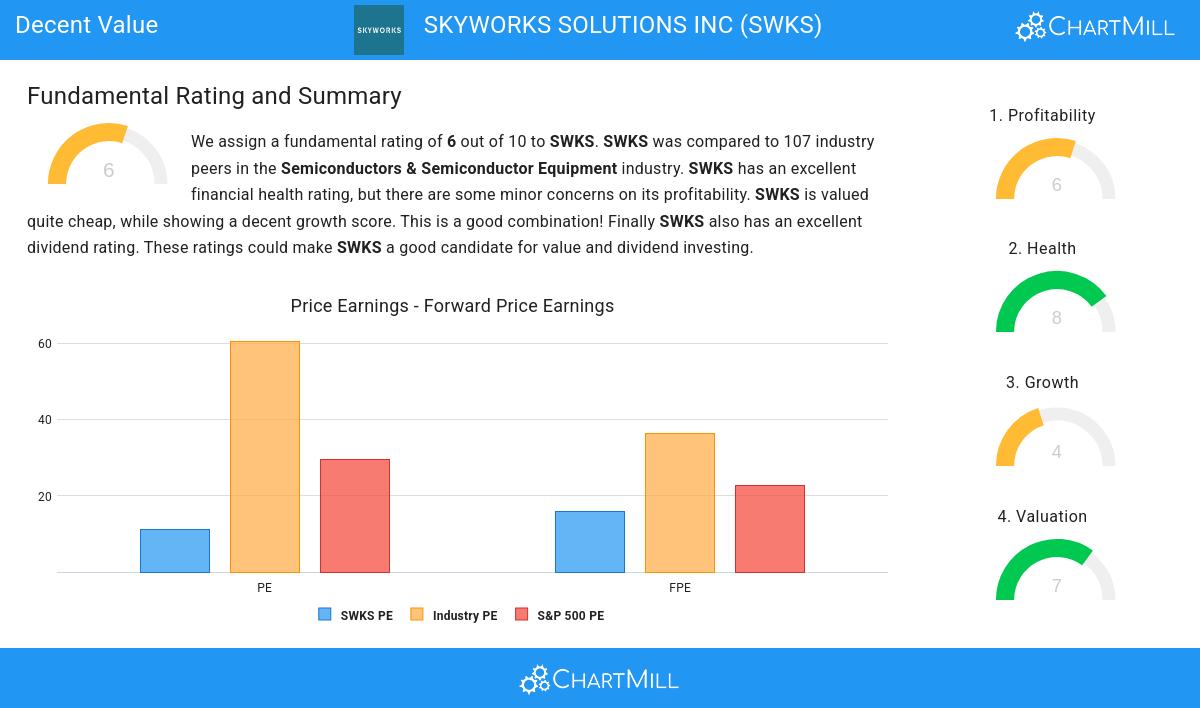
To assess a stock's valuation, ChartMill utilizes a Valuation Rating on a scale of 0 to 10. This comprehensive assessment considers various valuation aspects, comparing price to earnings and cash flows, while factoring in profitability and growth. NASDAQ:SWKS has achieved a 7 out of 10:
- Based on the Price/Earnings ratio of 11.26, the valuation of SWKS can be described as reasonable.
- Based on the Price/Earnings ratio, SWKS is valued cheaply inside the industry as 94.39% of the companies are valued more expensively.
- SWKS is valuated cheaply when we compare the Price/Earnings ratio to 29.53, which is the current average of the S&P500 Index.
- Based on the Price/Forward Earnings ratio, SWKS is valued cheaply inside the industry as 85.98% of the companies are valued more expensively.
- The average S&P500 Price/Forward Earnings ratio is at 22.65. SWKS is valued slightly cheaper when compared to this.
- Based on the Enterprise Value to EBITDA ratio, SWKS is valued cheaper than 91.59% of the companies in the same industry.
- SWKS's Price/Free Cash Flow ratio is rather cheap when compared to the industry. SWKS is cheaper than 100.00% of the companies in the same industry.
- The decent profitability rating of SWKS may justify a higher PE ratio.
What does the Profitability looks like for NASDAQ:SWKS
ChartMill assigns a Profitability Rating to every stock. This score ranges from 0 to 10 and evaluates the different profitability ratios and margins, both absolutely, but also relative to the industry peers. NASDAQ:SWKS scores a 6 out of 10:
- SWKS has a Return On Assets of 6.32%. This is in the better half of the industry: SWKS outperforms 69.16% of its industry peers.
- Looking at the Return On Equity, with a value of 8.23%, SWKS is in the better half of the industry, outperforming 61.68% of the companies in the same industry.
- SWKS has a Return On Invested Capital of 7.09%. This is in the better half of the industry: SWKS outperforms 71.96% of its industry peers.
- The last Return On Invested Capital (7.09%) for SWKS is well below the 3 year average (12.13%), which needs to be investigated, but indicates that SWKS had better years and this may not be a problem.
- SWKS has a better Profit Margin (13.02%) than 69.16% of its industry peers.
- SWKS's Operating Margin of 17.19% is fine compared to the rest of the industry. SWKS outperforms 74.77% of its industry peers.
A Closer Look at Health for NASDAQ:SWKS
ChartMill employs its own Health Rating for stock assessment. This rating, ranging from 0 to 10, is calculated by examining various liquidity and solvency ratios. In the case of NASDAQ:SWKS, the assigned 8 reflects its health status:
- SWKS has an Altman-Z score of 5.52. This indicates that SWKS is financially healthy and has little risk of bankruptcy at the moment.
- SWKS has a better Altman-Z score (5.52) than 62.62% of its industry peers.
- SWKS has a debt to FCF ratio of 0.81. This is a very positive value and a sign of high solvency as it would only need 0.81 years to pay back of all of its debts.
- SWKS's Debt to FCF ratio of 0.81 is amongst the best of the industry. SWKS outperforms 81.31% of its industry peers.
- A Debt/Equity ratio of 0.16 indicates that SWKS is not too dependend on debt financing.
- SWKS has a Current Ratio of 5.94. This indicates that SWKS is financially healthy and has no problem in meeting its short term obligations.
- The Current ratio of SWKS (5.94) is better than 85.05% of its industry peers.
- A Quick Ratio of 4.73 indicates that SWKS has no problem at all paying its short term obligations.
- SWKS has a Quick ratio of 4.73. This is amongst the best in the industry. SWKS outperforms 82.24% of its industry peers.
Growth Analysis for NASDAQ:SWKS
ChartMill employs its own Growth Rating system for all stocks. This score, ranging from 0 to 10, is derived by evaluating different growth factors, such as EPS and revenue growth, taking into account both past performance and future projections. NASDAQ:SWKS has earned a 4 for growth:
- Based on estimates for the next years, SWKS will show a quite strong growth in Earnings Per Share. The EPS will grow by 8.48% on average per year.
- The EPS growth rate is accelerating: in the next years the growth will be better than in the last years.
Our Decent Value screener lists more Decent Value stocks and is updated daily.
Our latest full fundamental report of SWKS contains the most current fundamental analsysis.
Disclaimer
Important Note: The content of this article is not intended as trading advice. It is essential to perform your own analysis and exercise caution when making trading decisions. The article presents observations created by automated analysis but does not guarantee any trading or investment outcomes. Always trade responsibly and make independent judgments.
55.98
+0.12 (+0.21%)
Find more stocks in the Stock Screener
SWKS Latest News and Analysis
 4 days ago - ChartmillGapping S&P500 stocks in Monday's session
Looking for opportunities in today's market? Check out the S&P500 gap up and gap down stocks on Monday and stay ahead of the market trends.
 8 days ago - ChartmillTop S&P500 movers in Thursday's session
Let's have a look at what is happening on the US markets one hour before the close of the markets on Thursday. Below you can find the top S&P500 gainers and losers in today's session.
8 days ago - ChartmillWhat's going on in today's session: S&P500 moversStay updated with the movements of the S&P500 index in the middle of the day on Thursday. Discover which stocks are leading as top gainers and losers in today's session.
9 days ago - ChartmillWhat's going on in today's session: S&P500 moversStay informed about the performance of the S&P500 index in the middle of the day on Wednesday. Uncover the top gainers and losers in today's session for valuable insights.
