Is SCORPIO TANKERS INC (NYSE:STNG) suited for dividend investing?
By Mill Chart
Last update: Mar 8, 2025
Unearth the potential of SCORPIO TANKERS INC (NYSE:STNG) as a dividend stock recommended by our stock screening tool. NYSE:STNG maintains a robust financial footing and delivers a sustainable dividend. We'll delve into the details below.
Analyzing Dividend Metrics
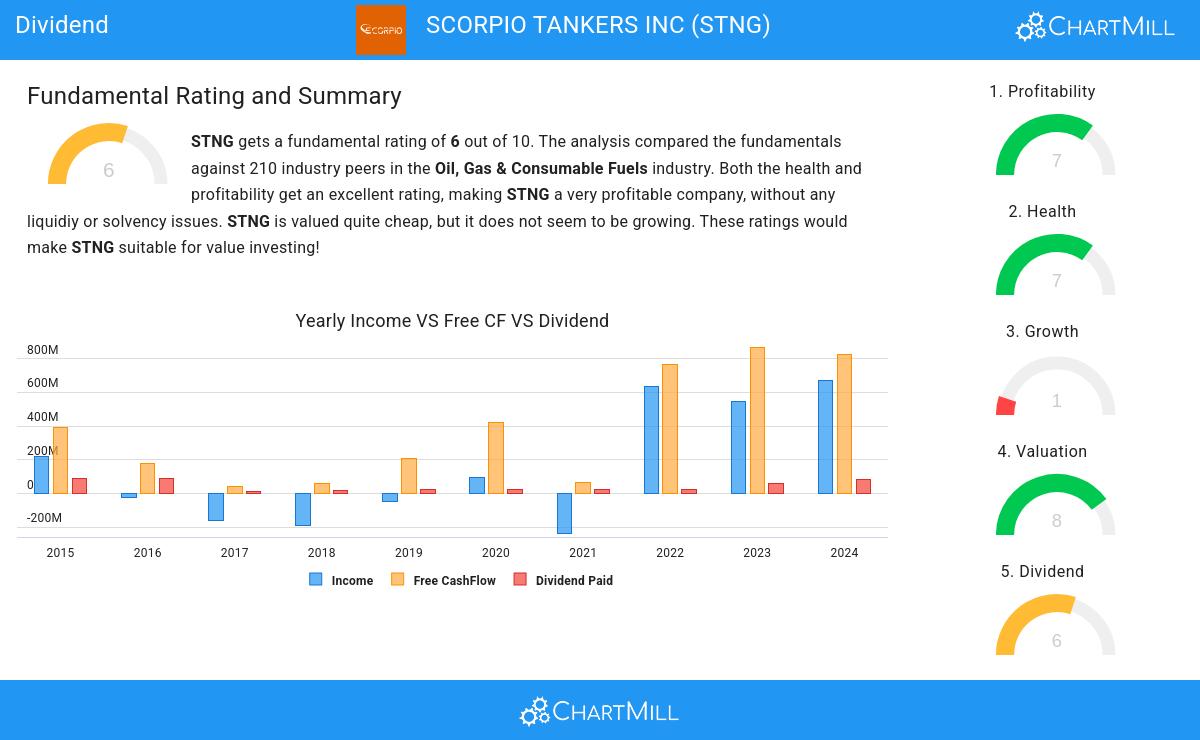
ChartMill assigns a proprietary Dividend Rating to each stock. The score is computed by evaluating various valuation aspects, like the yield, the history, the dividend growth and sustainability. NYSE:STNG was assigned a score of 6 for dividend:
- STNG's Dividend Yield is rather good when compared to the S&P500 average which is at 2.30.
- On average, the dividend of STNG grows each year by 22.93%, which is quite nice.
- STNG has been paying a dividend for at least 10 years, so it has a reliable track record.
- 12.49% of the earnings are spent on dividend by STNG. This is a low number and sustainable payout ratio.
Understanding NYSE:STNG's Health Score
Every stock is evaluated by ChartMill, receiving a Health Rating on a scale of 0 to 10. This assessment considers different health aspects, including liquidity and solvency, both in absolute terms and relative to industry peers. NYSE:STNG has achieved a 7 out of 10:
- STNG has a better Altman-Z score (2.62) than 76.19% of its industry peers.
- STNG has a debt to FCF ratio of 1.04. This is a very positive value and a sign of high solvency as it would only need 1.04 years to pay back of all of its debts.
- STNG's Debt to FCF ratio of 1.04 is amongst the best of the industry. STNG outperforms 87.14% of its industry peers.
- STNG has a Debt/Equity ratio of 0.25. This is a healthy value indicating a solid balance between debt and equity.
- STNG has a better Debt to Equity ratio (0.25) than 64.29% of its industry peers.
- A Current Ratio of 2.43 indicates that STNG has no problem at all paying its short term obligations.
- The Current ratio of STNG (2.43) is better than 77.62% of its industry peers.
- A Quick Ratio of 2.39 indicates that STNG has no problem at all paying its short term obligations.
- Looking at the Quick ratio, with a value of 2.39, STNG is in the better half of the industry, outperforming 78.10% of the companies in the same industry.
Understanding NYSE:STNG's Profitability
ChartMill assigns a proprietary Profitability Rating to each stock. The score is computed by evaluating various profitability ratios and margins and ranges from 0 to 10. NYSE:STNG was assigned a score of 7 for profitability:
- STNG has a better Return On Assets (17.44%) than 90.48% of its industry peers.
- STNG has a better Return On Equity (23.34%) than 81.90% of its industry peers.
- The Return On Invested Capital of STNG (12.92%) is better than 80.00% of its industry peers.
- STNG has a better Profit Margin (53.76%) than 91.90% of its industry peers.
- STNG has a Operating Margin of 47.27%. This is amongst the best in the industry. STNG outperforms 88.10% of its industry peers.
- In the last couple of years the Operating Margin of STNG has grown nicely.
- STNG's Gross Margin of 74.34% is amongst the best of the industry. STNG outperforms 84.29% of its industry peers.
- STNG's Gross Margin has improved in the last couple of years.
More Best Dividend stocks can be found in our Best Dividend screener.
For an up to date full fundamental analysis you can check the fundamental report of STNG
Keep in mind
This article should in no way be interpreted as advice. The article is based on the observed metrics at the time of writing, but you should always make your own analysis and trade or invest at your own responsibility.
37.8
+1.22 (+3.34%)
Find more stocks in the Stock Screener
STNG Latest News and Analysis
 8 days ago - ChartmillWhy SCORPIO TANKERS INC (NYSE:STNG) is a Top Pick for Dividend Investors.
Why SCORPIO TANKERS INC (NYSE:STNG) qualifies as a good dividend investing stock.
