
Our stock screener has singled out STMICROELECTRONICS NV-NY SHS (NYSE:STM) as a stellar value proposition. NYSE:STM not only scores well in profitability, solvency, and liquidity but also maintains a very reasonable price point. We'll explore this further.
ChartMill's Evaluation of Valuation
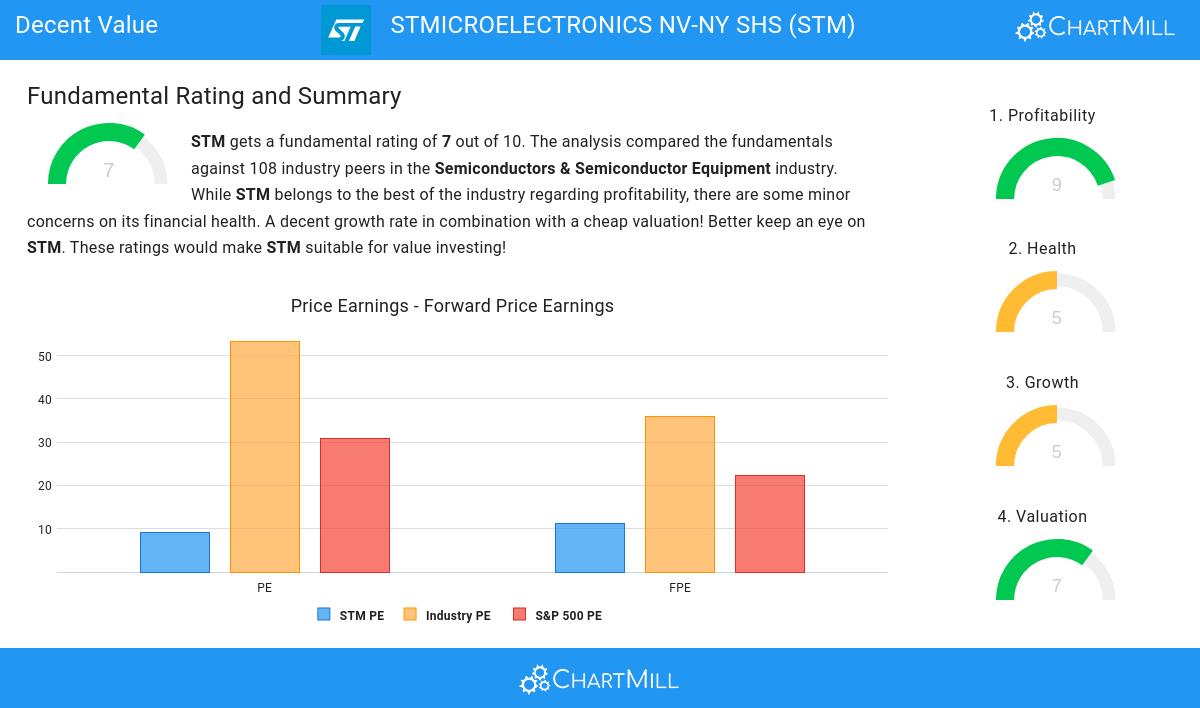
ChartMill employs its own Valuation Rating system for all stocks. This score, ranging from 0 to 10, is determined by evaluating different valuation factors, including price to earnings and free cash flow, both in absolute terms and relative to the market and industry. NYSE:STM has earned a 7 for valuation:
- A Price/Earnings ratio of 9.16 indicates a reasonable valuation of STM.
- 99.07% of the companies in the same industry are more expensive than STM, based on the Price/Earnings ratio.
- The average S&P500 Price/Earnings ratio is at 30.91. STM is valued rather cheaply when compared to this.
- STM is valuated reasonably with a Price/Forward Earnings ratio of 11.17.
- Compared to the rest of the industry, the Price/Forward Earnings ratio of STM indicates a rather cheap valuation: STM is cheaper than 95.37% of the companies listed in the same industry.
- The average S&P500 Price/Forward Earnings ratio is at 22.30. STM is valued slightly cheaper when compared to this.
- Based on the Enterprise Value to EBITDA ratio, STM is valued cheaper than 98.15% of the companies in the same industry.
- Compared to the rest of the industry, the Price/Free Cash Flow ratio of STM indicates a somewhat cheap valuation: STM is cheaper than 76.85% of the companies listed in the same industry.
- The excellent profitability rating of STM may justify a higher PE ratio.
Profitability Insights: NYSE:STM
ChartMill utilizes a Profitability Rating to assess stocks, scoring them on a scale of 0 to 10. This rating takes into account a variety of profitability ratios and margins, both in absolute terms and in comparison to industry peers. NYSE:STM has earned a 9 out of 10:
- STM has a better Return On Assets (20.62%) than 95.37% of its industry peers.
- STM has a better Return On Equity (29.96%) than 92.59% of its industry peers.
- STM's Return On Invested Capital of 24.36% is amongst the best of the industry. STM outperforms 95.37% of its industry peers.
- The Average Return On Invested Capital over the past 3 years for STM is significantly above the industry average of 10.86%.
- The last Return On Invested Capital (24.36%) for STM is above the 3 year average (20.86%), which is a sign of increasing profitability.
- With an excellent Profit Margin value of 22.25%, STM belongs to the best of the industry, outperforming 82.41% of the companies in the same industry.
- In the last couple of years the Profit Margin of STM has grown nicely.
- STM has a Operating Margin of 23.58%. This is amongst the best in the industry. STM outperforms 81.48% of its industry peers.
- In the last couple of years the Operating Margin of STM has grown nicely.
- In the last couple of years the Gross Margin of STM has grown nicely.
Assessing Health for NYSE:STM
A critical element of ChartMill's stock evaluation is the Health Rating, which spans from 0 to 10. This rating considers multiple health factors, including liquidity and solvency, both in absolute terms and relative to industry peers. NYSE:STM has received a 5 out of 10:
- An Altman-Z score of 4.59 indicates that STM is not in any danger for bankruptcy at the moment.
- STM has a debt to FCF ratio of 3.81. This is a good value and a sign of high solvency as STM would need 3.81 years to pay back of all of its debts.
- A Debt/Equity ratio of 0.07 indicates that STM is not too dependend on debt financing.
- STM has a Current Ratio of 2.27. This indicates that STM is financially healthy and has no problem in meeting its short term obligations.
Growth Examination for NYSE:STM
ChartMill assigns a Growth Rating to every stock. This score ranges from 0 to 10 and evaluates the different growth aspects like EPS and Revenue, both in the past as in the future. NYSE:STM scores a 5 out of 10:
- STM shows a strong growth in Earnings Per Share. Measured over the last years, the EPS has been growing by 25.72% yearly.
- Looking at the last year, STM shows a very strong growth in Revenue. The Revenue has grown by 38.49%.
- Measured over the past years, STM shows a quite strong growth in Revenue. The Revenue has been growing by 12.33% on average per year.
Every day, new Decent Value stocks can be found on ChartMill in our Decent Value screener.
Check the latest full fundamental report of STM for a complete fundamental analysis.
Keep in mind
Important Note: The content of this article is not intended as trading advice. It is essential to perform your own analysis and exercise caution when making trading decisions. The article presents observations created by automated analysis but does not guarantee any trading or investment outcomes. Always trade responsibly and make independent judgments.