
Uncover the hidden value in STMICROELECTRONICS NV-NY SHS (NYSE:STM) as our stock screening tool recommends it as an undervalued choice. NYSE:STM maintains a robust financial position and offers an attractive pricing perspective. Let's dig deeper into the analysis.
How do we evaluate the Valuation for NYSE:STM?
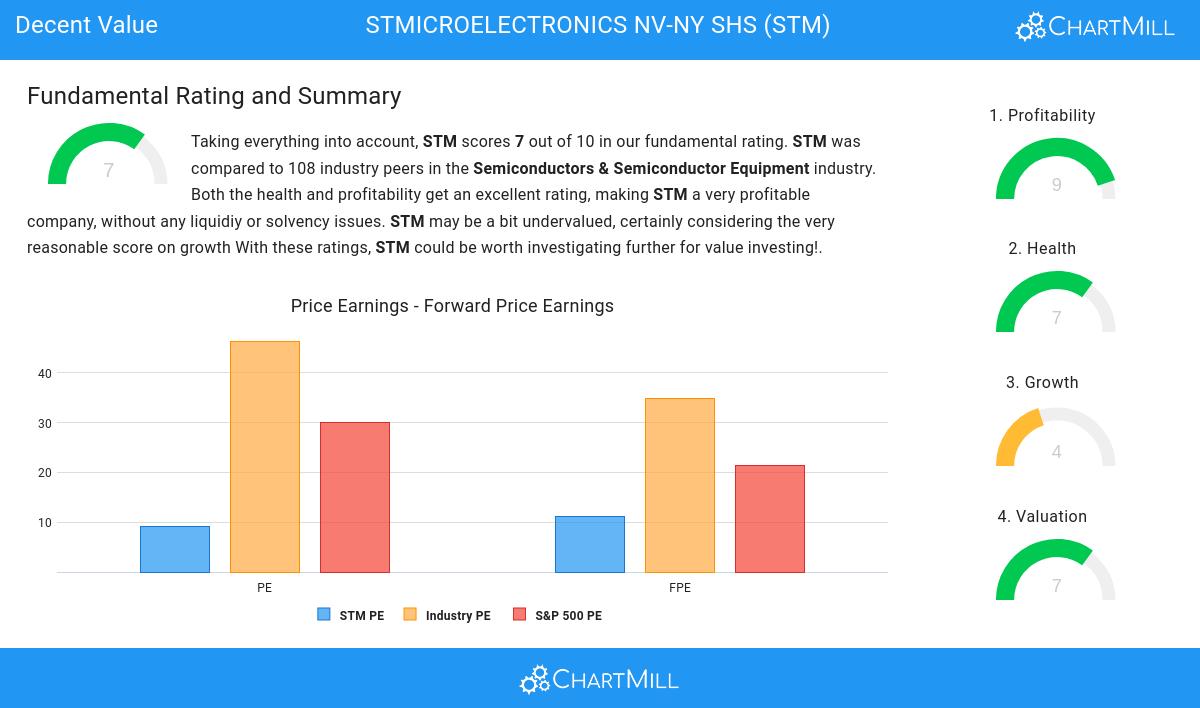
ChartMill employs its own Valuation Rating system for all stocks. This score, ranging from 0 to 10, is determined by evaluating different valuation factors, including price to earnings and free cash flow, both in absolute terms and relative to the market and industry. NYSE:STM has earned a 7 for valuation:
- Based on the Price/Earnings ratio of 9.16, the valuation of STM can be described as reasonable.
- STM's Price/Earnings ratio is rather cheap when compared to the industry. STM is cheaper than 98.15% of the companies in the same industry.
- STM's Price/Earnings ratio indicates a rather cheap valuation when compared to the S&P500 average which is at 29.93.
- A Price/Forward Earnings ratio of 11.18 indicates a reasonable valuation of STM.
- Based on the Price/Forward Earnings ratio, STM is valued cheaper than 91.67% of the companies in the same industry.
- STM's Price/Forward Earnings ratio indicates a valuation a bit cheaper than the S&P500 average which is at 21.45.
- Compared to the rest of the industry, the Enterprise Value to EBITDA ratio of STM indicates a rather cheap valuation: STM is cheaper than 98.15% of the companies listed in the same industry.
- 87.04% of the companies in the same industry are more expensive than STM, based on the Price/Free Cash Flow ratio.
- The excellent profitability rating of STM may justify a higher PE ratio.
Exploring NYSE:STM's Profitability
ChartMill assigns a proprietary Profitability Rating to each stock. The score is computed by evaluating various profitability ratios and margins and ranges from 0 to 10. NYSE:STM was assigned a score of 9 for profitability:
- The Return On Assets of STM (24.28%) is better than 97.22% of its industry peers.
- STM's Return On Equity of 35.49% is amongst the best of the industry. STM outperforms 95.37% of its industry peers.
- STM's Return On Invested Capital of 30.43% is amongst the best of the industry. STM outperforms 98.15% of its industry peers.
- STM had an Average Return On Invested Capital over the past 3 years of 20.86%. This is significantly above the industry average of 10.76%.
- The last Return On Invested Capital (30.43%) for STM is above the 3 year average (20.86%), which is a sign of increasing profitability.
- With an excellent Profit Margin value of 22.96%, STM belongs to the best of the industry, outperforming 81.48% of the companies in the same industry.
- In the last couple of years the Profit Margin of STM has grown nicely.
- The Operating Margin of STM (27.40%) is better than 85.19% of its industry peers.
- In the last couple of years the Operating Margin of STM has grown nicely.
- STM has a better Gross Margin (48.21%) than 61.11% of its industry peers.
- STM's Gross Margin has improved in the last couple of years.
How do we evaluate the Health for NYSE:STM?
Every stock is evaluated by ChartMill, receiving a Health Rating on a scale of 0 to 10. This assessment considers different health aspects, including liquidity and solvency, both in absolute terms and relative to industry peers. NYSE:STM has achieved a 7 out of 10:
- An Altman-Z score of 5.17 indicates that STM is not in any danger for bankruptcy at the moment.
- STM has a Altman-Z score of 5.17. This is in the better half of the industry: STM outperforms 61.11% of its industry peers.
- STM has a debt to FCF ratio of 1.99. This is a very positive value and a sign of high solvency as it would only need 1.99 years to pay back of all of its debts.
- Looking at the Debt to FCF ratio, with a value of 1.99, STM is in the better half of the industry, outperforming 71.30% of the companies in the same industry.
- STM has a Debt/Equity ratio of 0.16. This is a healthy value indicating a solid balance between debt and equity.
- A Current Ratio of 3.17 indicates that STM has no problem at all paying its short term obligations.
- STM has a Quick Ratio of 2.44. This indicates that STM is financially healthy and has no problem in meeting its short term obligations.
How We Gauge Growth for NYSE:STM
A key component of ChartMill's stock assessment is the Growth Rating, which spans from 0 to 10. This rating evaluates diverse growth factors, such as EPS and revenue growth, considering both past performance and future projections. NYSE:STM has received a 4 out of 10:
- STM shows a strong growth in Earnings Per Share. Measured over the last years, the EPS has been growing by 25.72% yearly.
- Measured over the past years, STM shows a quite strong growth in Revenue. The Revenue has been growing by 12.33% on average per year.
More Decent Value stocks can be found in our Decent Value screener.
Check the latest full fundamental report of STM for a complete fundamental analysis.
Keep in mind
This article should in no way be interpreted as advice. The article is based on the observed metrics at the time of writing, but you should always make your own analysis and trade or invest at your own responsibility.