Uncovering Dividend Opportunities with NYSE:STLA.
By Mill Chart
Last update: Oct 16, 2024
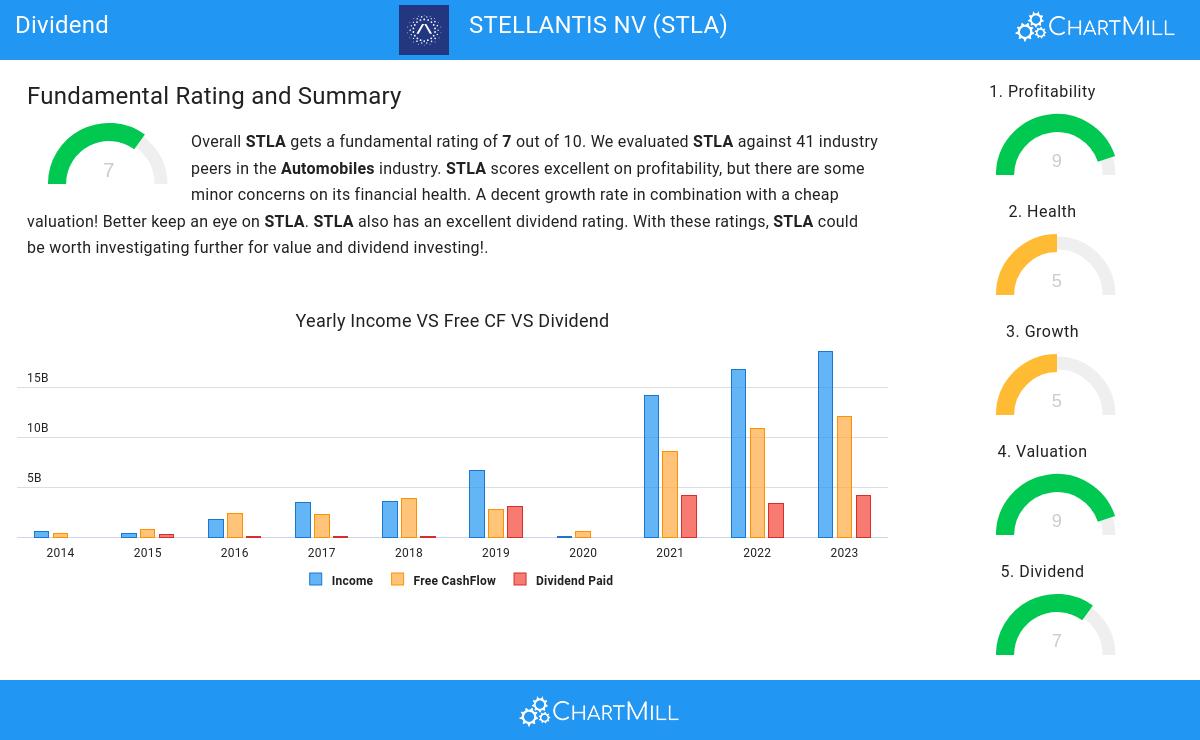
Discover STELLANTIS NV (NYSE:STLA)—a stock that our stock screener has recognized as a solid dividend pick with strong fundamentals. NYSE:STLA showcases decent financial health and profitability while providing a sustainable dividend. We'll explore the specifics further.
Dividend Assessment of NYSE:STLA
An integral part of ChartMill's stock analysis is the Dividend Rating, which spans from 0 to 10. This rating evaluates diverse dividend factors, including yield, historical data, growth, and sustainability. NYSE:STLA has received a 7 out of 10:
- STLA has a Yearly Dividend Yield of 12.71%, which is a nice return.
- STLA's Dividend Yield is rather good when compared to the industry average which is at 3.71. STLA pays more dividend than 100.00% of the companies in the same industry.
- Compared to an average S&P500 Dividend Yield of 2.22, STLA pays a better dividend.
- The dividend of STLA is nicely growing with an annual growth rate of 386.64%!
- STLA has been paying a dividend for over 5 years, so it has already some track record.
- STLA pays out 22.63% of its income as dividend. This is a sustainable payout ratio.
Assessing Health for NYSE:STLA
ChartMill employs its own Health Rating for stock assessment. This rating, ranging from 0 to 10, is calculated by examining various liquidity and solvency ratios. In the case of NYSE:STLA, the assigned 5 reflects its health status:
- STLA has a better Altman-Z score (2.15) than 78.05% of its industry peers.
- The Debt to FCF ratio of STLA is 2.43, which is a good value as it means it would take STLA, 2.43 years of fcf income to pay off all of its debts.
- With an excellent Debt to FCF ratio value of 2.43, STLA belongs to the best of the industry, outperforming 100.00% of the companies in the same industry.
- STLA has a Debt/Equity ratio of 0.24. This is a healthy value indicating a solid balance between debt and equity.
Profitability Assessment of NYSE:STLA
ChartMill utilizes a Profitability Rating to assess stocks, scoring them on a scale of 0 to 10. This rating takes into account a variety of profitability ratios and margins, both in absolute terms and in comparison to industry peers. NYSE:STLA has earned a 9 out of 10:
- STLA's Return On Assets of 9.20% is amongst the best of the industry. STLA outperforms 92.68% of its industry peers.
- STLA has a Return On Equity of 22.76%. This is amongst the best in the industry. STLA outperforms 92.68% of its industry peers.
- Looking at the Return On Invested Capital, with a value of 15.22%, STLA belongs to the top of the industry, outperforming 95.12% of the companies in the same industry.
- Measured over the past 3 years, the Average Return On Invested Capital for STLA is above the industry average of 10.90%.
- The last Return On Invested Capital (15.22%) for STLA is above the 3 year average (14.80%), which is a sign of increasing profitability.
- The Profit Margin of STLA (9.81%) is better than 87.80% of its industry peers.
- In the last couple of years the Profit Margin of STLA has grown nicely.
- STLA has a better Operating Margin (12.19%) than 95.12% of its industry peers.
- STLA's Operating Margin has improved in the last couple of years.
- With a decent Gross Margin value of 20.12%, STLA is doing good in the industry, outperforming 73.17% of the companies in the same industry.
- In the last couple of years the Gross Margin of STLA has grown nicely.
Our Best Dividend screener lists more Best Dividend stocks and is updated daily.
Our latest full fundamental report of STLA contains the most current fundamental analsysis.
Disclaimer
This article should in no way be interpreted as advice. The article is based on the observed metrics at the time of writing, but you should always make your own analysis and trade or invest at your own responsibility.
9.36
-0.06 (-0.64%)
Find more stocks in the Stock Screener
STLA Latest News and Analysis
 14 days ago - ChartmillMarket Monitor April 15 Before Market Open ( Dell, Palantir UP, Meta DOWN)
Wall Street Starts Easter Week Strong as Tariff Concerns Ease
 18 days ago - ChartmillExploring STELLANTIS NV (NYSE:STLA)'s dividend characteristics.
Is STELLANTIS NV (NYSE:STLA) a Good Fit for Dividend Investing?
