
STELLANTIS NV (NYSE:STLA) was identified as a stock worth exploring by dividend investors by our stock screener. NYSE:STLA scores well on profitability, solvency and liquidity. At the same time it seems to pay a decent dividend. We'll explore this a bit deeper below.
Understanding NYSE:STLA's Dividend Score
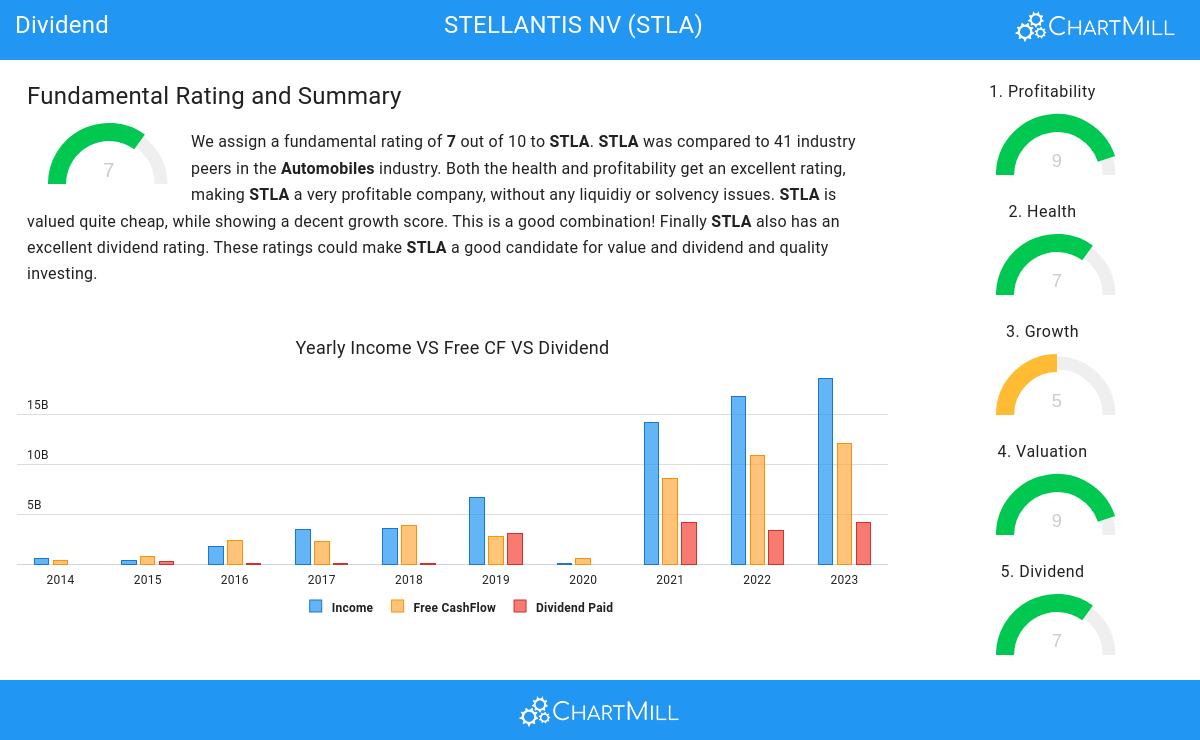
An integral part of ChartMill's stock analysis is the Dividend Rating, which spans from 0 to 10. This rating evaluates diverse dividend factors, including yield, historical data, growth, and sustainability. NYSE:STLA has received a 7 out of 10:
- With a Yearly Dividend Yield of 10.23%, STLA is a good candidate for dividend investing.
- Compared to an average industry Dividend Yield of 3.34, STLA pays a better dividend. On top of this STLA pays more dividend than 100.00% of the companies listed in the same industry.
- STLA's Dividend Yield is rather good when compared to the S&P500 average which is at 2.24.
- On average, the dividend of STLA grows each year by 386.64%, which is quite nice.
- STLA has been paying a dividend for over 5 years, so it has already some track record.
- 22.63% of the earnings are spent on dividend by STLA. This is a low number and sustainable payout ratio.
What does the Health looks like for NYSE:STLA
ChartMill employs a unique Health Rating system for all stocks. This rating, ranging from 0 to 10, is determined by analyzing various liquidity and solvency ratios. For NYSE:STLA, the assigned 7 for health provides valuable insights:
- STLA's Altman-Z score of 2.20 is fine compared to the rest of the industry. STLA outperforms 75.61% of its industry peers.
- STLA has a debt to FCF ratio of 2.43. This is a good value and a sign of high solvency as STLA would need 2.43 years to pay back of all of its debts.
- With an excellent Debt to FCF ratio value of 2.43, STLA belongs to the best of the industry, outperforming 95.12% of the companies in the same industry.
- A Debt/Equity ratio of 0.24 indicates that STLA is not too dependend on debt financing.
- With a decent Debt to Equity ratio value of 0.24, STLA is doing good in the industry, outperforming 60.98% of the companies in the same industry.
- The current and quick ratio evaluation for STLA is rather negative, while it does have excellent solvency and profitability. These ratios do not necessarly indicate liquidity issues and need to be evaluated against the specifics of the business.
How do we evaluate the Profitability for NYSE:STLA?
Discover ChartMill's exclusive Profitability Rating, a proprietary metric that assesses stocks on a scale of 0 to 10. It takes into consideration various profitability ratios and margins, both in absolute terms and relative to industry peers. Notably, NYSE:STLA has achieved a 9:
- The Return On Assets of STLA (9.20%) is better than 92.68% of its industry peers.
- Looking at the Return On Equity, with a value of 22.76%, STLA belongs to the top of the industry, outperforming 92.68% of the companies in the same industry.
- Looking at the Return On Invested Capital, with a value of 15.22%, STLA belongs to the top of the industry, outperforming 95.12% of the companies in the same industry.
- The Average Return On Invested Capital over the past 3 years for STLA is above the industry average of 11.00%.
- The last Return On Invested Capital (15.22%) for STLA is above the 3 year average (14.80%), which is a sign of increasing profitability.
- Looking at the Profit Margin, with a value of 9.81%, STLA belongs to the top of the industry, outperforming 87.80% of the companies in the same industry.
- In the last couple of years the Profit Margin of STLA has grown nicely.
- STLA has a Operating Margin of 12.19%. This is amongst the best in the industry. STLA outperforms 95.12% of its industry peers.
- STLA's Operating Margin has improved in the last couple of years.
- The Gross Margin of STLA (20.12%) is better than 73.17% of its industry peers.
- In the last couple of years the Gross Margin of STLA has grown nicely.
More Best Dividend stocks can be found in our Best Dividend screener.
Check the latest full fundamental report of STLA for a complete fundamental analysis.
Disclaimer
Important Note: The content of this article is not intended as trading advice. It is essential to perform your own analysis and exercise caution when making trading decisions. The article presents observations created by automated analysis but does not guarantee any trading or investment outcomes. Always trade responsibly and make independent judgments.