
Investors seeking growth at a reasonable cost should explore NASDAQ:STAA.
By Mill Chart
Last update: Oct 9, 2024
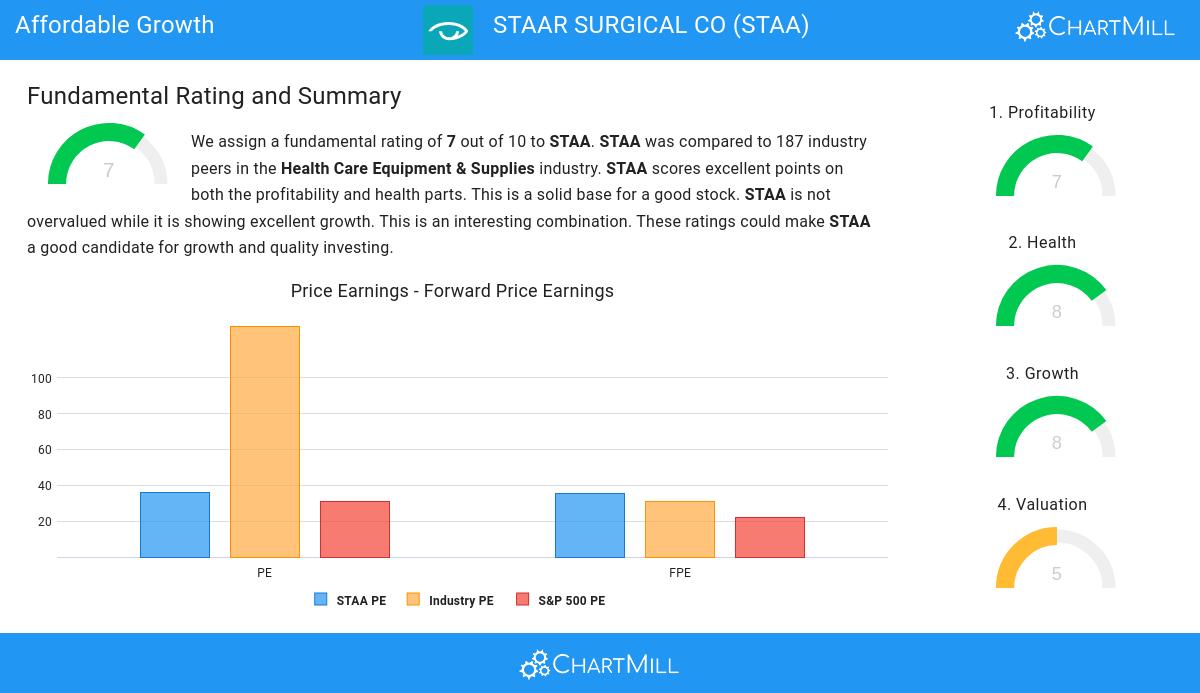
Our stock screener has spotted STAAR SURGICAL CO (NASDAQ:STAA) as a growth stock which is not overvalued. NASDAQ:STAA is scoring great on several growth aspects while it also shows decent health and profitability. At the same time it remains remains attractively priced. We'll dive into each aspect below.
Growth Analysis for NASDAQ:STAA
ChartMill assigns a proprietary Growth Rating to each stock. The score is computed by evaluating various growth aspects, like EPS and revenue growth. We take into account the history as well as the estimated future numbers. NASDAQ:STAA was assigned a score of 8 for growth:
- STAA shows a strong growth in Earnings Per Share. In the last year, the EPS has been growing by 76.00%, which is quite impressive.
- Measured over the past years, STAA shows a very strong growth in Earnings Per Share. The EPS has been growing by 43.10% on average per year.
- Looking at the last year, STAA shows a quite strong growth in Revenue. The Revenue has grown by 8.83% in the last year.
- Measured over the past years, STAA shows a very strong growth in Revenue. The Revenue has been growing by 21.06% on average per year.
- Based on estimates for the next years, STAA will show a very strong growth in Earnings Per Share. The EPS will grow by 26.82% on average per year.
- The Revenue is expected to grow by 14.86% on average over the next years. This is quite good.
Deciphering NASDAQ:STAA's Valuation Rating
ChartMill employs its own Valuation Rating system for all stocks. This score, ranging from 0 to 10, is determined by evaluating different valuation factors, including price to earnings and free cash flow, both in absolute terms and relative to the market and industry. NASDAQ:STAA has earned a 5 for valuation:
- STAA's Price/Earnings ratio is a bit cheaper when compared to the industry. STAA is cheaper than 73.12% of the companies in the same industry.
- 72.04% of the companies in the same industry are more expensive than STAA, based on the Price/Forward Earnings ratio.
- Based on the Enterprise Value to EBITDA ratio, STAA is valued a bit cheaper than 67.74% of the companies in the same industry.
- STAA's Price/Free Cash Flow ratio is a bit cheaper when compared to the industry. STAA is cheaper than 70.43% of the companies in the same industry.
- The decent profitability rating of STAA may justify a higher PE ratio.
- A more expensive valuation may be justified as STAA's earnings are expected to grow with 28.02% in the coming years.
Deciphering NASDAQ:STAA's Health Rating
ChartMill utilizes a Health Rating to assess stocks, scoring them on a scale of 0 to 10. This rating takes into account a variety of liquidity and solvency ratios, both in absolute terms and in comparison to industry peers. NASDAQ:STAA has earned a 8 out of 10:
- STAA has an Altman-Z score of 10.40. This indicates that STAA is financially healthy and has little risk of bankruptcy at the moment.
- STAA has a Altman-Z score of 10.40. This is amongst the best in the industry. STAA outperforms 88.17% of its industry peers.
- STAA has no outstanding debt. Therefor its Debt/Equity and Debt/FCF ratios are 0 and belong to the best of the industry.
- A Current Ratio of 5.80 indicates that STAA has no problem at all paying its short term obligations.
- STAA's Current ratio of 5.80 is fine compared to the rest of the industry. STAA outperforms 78.49% of its industry peers.
- STAA has a Quick Ratio of 5.21. This indicates that STAA is financially healthy and has no problem in meeting its short term obligations.
- Looking at the Quick ratio, with a value of 5.21, STAA is in the better half of the industry, outperforming 77.42% of the companies in the same industry.
Profitability Examination for NASDAQ:STAA
ChartMill assigns a Profitability Rating to every stock. This score ranges from 0 to 10 and evaluates the different profitability ratios and margins, both absolutely, but also relative to the industry peers. NASDAQ:STAA scores a 7 out of 10:
- Looking at the Return On Assets, with a value of 3.24%, STAA is in the better half of the industry, outperforming 77.42% of the companies in the same industry.
- With a decent Return On Equity value of 4.06%, STAA is doing good in the industry, outperforming 75.27% of the companies in the same industry.
- With a decent Return On Invested Capital value of 4.37%, STAA is doing good in the industry, outperforming 75.81% of the companies in the same industry.
- STAA has a Profit Margin of 4.99%. This is in the better half of the industry: STAA outperforms 76.88% of its industry peers.
- STAA's Profit Margin has improved in the last couple of years.
- The Operating Margin of STAA (7.91%) is better than 74.73% of its industry peers.
- In the last couple of years the Operating Margin of STAA has grown nicely.
- STAA has a Gross Margin of 79.24%. This is amongst the best in the industry. STAA outperforms 91.94% of its industry peers.
Our Affordable Growth screener lists more Affordable Growth stocks and is updated daily.
Check the latest full fundamental report of STAA for a complete fundamental analysis.
Keep in mind
This article should in no way be interpreted as advice. The article is based on the observed metrics at the time of writing, but you should always make your own analysis and trade or invest at your own responsibility.