
Here's STAAR SURGICAL CO (NASDAQ:STAA) for you, a growth stock our stock screener believes is undervalued. NASDAQ:STAA is scoring impressively in terms of growth while demonstrating strong financials. On top of that, it remains attractively priced. Let's break it down further.
Understanding NASDAQ:STAA's Growth Score
To evaluate a stock's growth potential, ChartMill utilizes a Growth Rating on a scale of 0 to 10. This comprehensive assessment considers various growth aspects, including historical and estimated EPS and revenue growth. NASDAQ:STAA has achieved a 8 out of 10:
- STAA shows a strong growth in Earnings Per Share. In the last year, the EPS has been growing by 76.00%, which is quite impressive.
- The Earnings Per Share has been growing by 43.10% on average over the past years. This is a very strong growth
- The Revenue has grown by 8.83% in the past year. This is quite good.
- The Revenue has been growing by 21.06% on average over the past years. This is a very strong growth!
- The Earnings Per Share is expected to grow by 26.82% on average over the next years. This is a very strong growth
- STAA is expected to show quite a strong growth in Revenue. In the coming years, the Revenue will grow by 14.86% yearly.
Deciphering NASDAQ:STAA's Valuation Rating
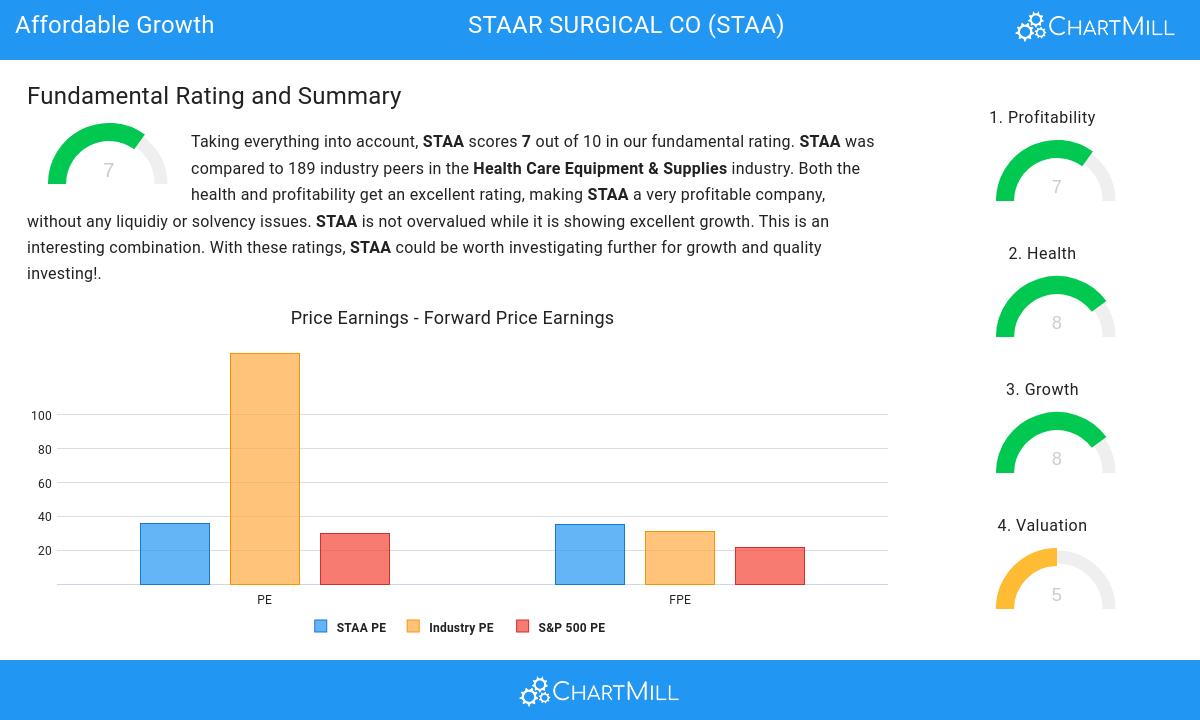
ChartMill employs its own Valuation Rating system for all stocks. This score, ranging from 0 to 10, is determined by evaluating different valuation factors, including price to earnings and free cash flow, both in absolute terms and relative to the market and industry. NASDAQ:STAA has earned a 5 for valuation:
- 74.07% of the companies in the same industry are more expensive than STAA, based on the Price/Earnings ratio.
- 73.02% of the companies in the same industry are more expensive than STAA, based on the Price/Forward Earnings ratio.
- STAA's Enterprise Value to EBITDA ratio is a bit cheaper when compared to the industry. STAA is cheaper than 68.78% of the companies in the same industry.
- 70.90% of the companies in the same industry are more expensive than STAA, based on the Price/Free Cash Flow ratio.
- The decent profitability rating of STAA may justify a higher PE ratio.
- A more expensive valuation may be justified as STAA's earnings are expected to grow with 28.66% in the coming years.
Analyzing Health Metrics
ChartMill utilizes a Health Rating to assess stocks, scoring them on a scale of 0 to 10. This rating takes into account a variety of liquidity and solvency ratios, both in absolute terms and in comparison to industry peers. NASDAQ:STAA has earned a 8 out of 10:
- STAA has an Altman-Z score of 10.40. This indicates that STAA is financially healthy and has little risk of bankruptcy at the moment.
- With an excellent Altman-Z score value of 10.40, STAA belongs to the best of the industry, outperforming 87.30% of the companies in the same industry.
- STAA has no outstanding debt. Therefor its Debt/Equity and Debt/FCF ratios are 0 and belong to the best of the industry.
- STAA has a Current Ratio of 5.80. This indicates that STAA is financially healthy and has no problem in meeting its short term obligations.
- STAA has a Current ratio of 5.80. This is in the better half of the industry: STAA outperforms 77.25% of its industry peers.
- A Quick Ratio of 5.21 indicates that STAA has no problem at all paying its short term obligations.
- The Quick ratio of STAA (5.21) is better than 76.19% of its industry peers.
Profitability Assessment of NASDAQ:STAA
ChartMill employs its own Profitability Rating system for stock evaluation. This score, ranging from 0 to 10, is derived from an analysis of diverse profitability metrics and margins. In the case of NASDAQ:STAA, the assigned 7 is noteworthy for profitability:
- With a decent Return On Assets value of 3.24%, STAA is doing good in the industry, outperforming 78.31% of the companies in the same industry.
- With a decent Return On Equity value of 4.06%, STAA is doing good in the industry, outperforming 76.19% of the companies in the same industry.
- Looking at the Return On Invested Capital, with a value of 4.37%, STAA is in the better half of the industry, outperforming 76.19% of the companies in the same industry.
- STAA's Profit Margin of 4.99% is fine compared to the rest of the industry. STAA outperforms 76.72% of its industry peers.
- In the last couple of years the Profit Margin of STAA has grown nicely.
- STAA has a better Operating Margin (7.91%) than 75.13% of its industry peers.
- In the last couple of years the Operating Margin of STAA has grown nicely.
- The Gross Margin of STAA (79.24%) is better than 91.53% of its industry peers.
Every day, new Affordable Growth stocks can be found on ChartMill in our Affordable Growth screener.
For an up to date full fundamental analysis you can check the fundamental report of STAA
Keep in mind
Important Note: The content of this article is not intended as trading advice. It is essential to perform your own analysis and exercise caution when making trading decisions. The article presents observations created by automated analysis but does not guarantee any trading or investment outcomes. Always trade responsibly and make independent judgments.