
Our stock screening tool has identified SHUTTERSTOCK INC (NYSE:SSTK) as an undervalued gem with strong fundamentals. NYSE:SSTK boasts decent financial health and profitability while maintaining an attractive price point. We'll break it down further.
Deciphering NYSE:SSTK's Valuation Rating
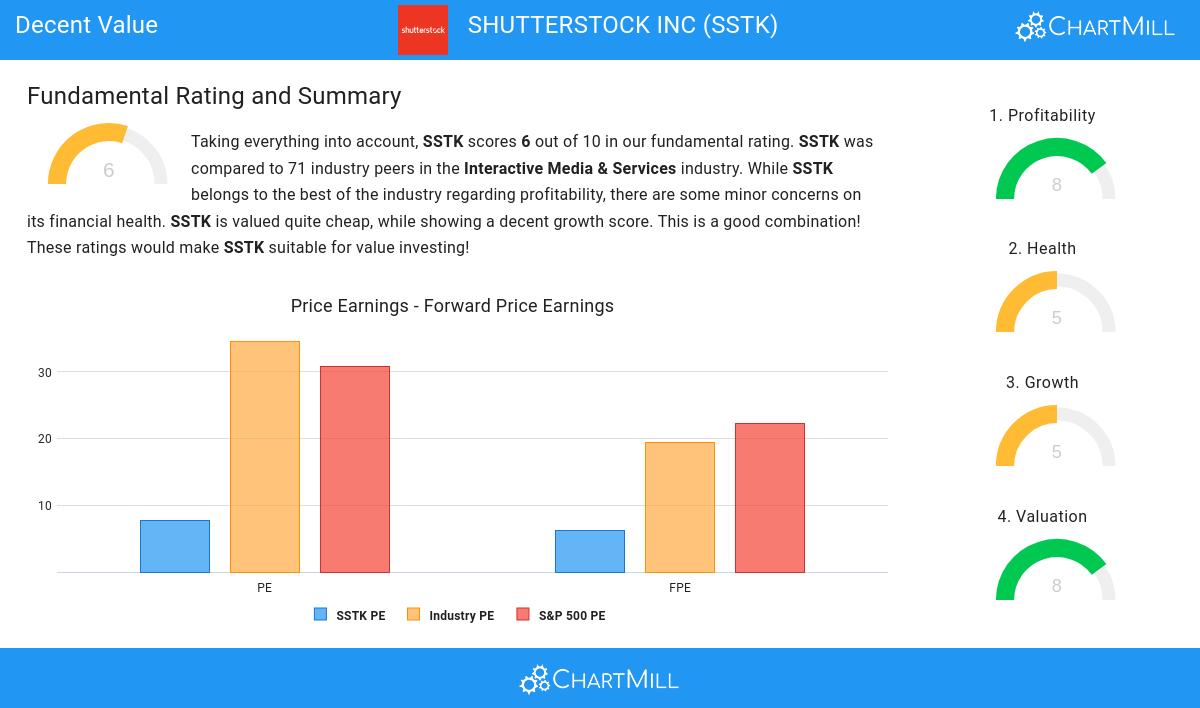
ChartMill assigns a Valuation Rating to every stock. This score ranges from 0 to 10 and evaluates the different valuation aspects and compares the price to earnings and cash flows, while taking into account profitability and growth. NYSE:SSTK scores a 8 out of 10:
- Based on the Price/Earnings ratio of 7.75, the valuation of SSTK can be described as very cheap.
- SSTK's Price/Earnings ratio is rather cheap when compared to the industry. SSTK is cheaper than 91.43% of the companies in the same industry.
- SSTK is valuated cheaply when we compare the Price/Earnings ratio to 30.77, which is the current average of the S&P500 Index.
- SSTK is valuated cheaply with a Price/Forward Earnings ratio of 6.28.
- Compared to the rest of the industry, the Price/Forward Earnings ratio of SSTK indicates a rather cheap valuation: SSTK is cheaper than 94.29% of the companies listed in the same industry.
- SSTK is valuated cheaply when we compare the Price/Forward Earnings ratio to 22.21, which is the current average of the S&P500 Index.
- SSTK's Enterprise Value to EBITDA ratio is rather cheap when compared to the industry. SSTK is cheaper than 85.71% of the companies in the same industry.
- Compared to the rest of the industry, the Price/Free Cash Flow ratio of SSTK indicates a somewhat cheap valuation: SSTK is cheaper than 65.71% of the companies listed in the same industry.
- The excellent profitability rating of SSTK may justify a higher PE ratio.
Understanding NYSE:SSTK's Profitability
ChartMill utilizes a Profitability Rating to assess stocks, scoring them on a scale of 0 to 10. This rating takes into account a variety of profitability ratios and margins, both in absolute terms and in comparison to industry peers. NYSE:SSTK has earned a 8 out of 10:
- SSTK's Return On Assets of 4.70% is fine compared to the rest of the industry. SSTK outperforms 80.00% of its industry peers.
- SSTK has a Return On Equity of 9.06%. This is amongst the best in the industry. SSTK outperforms 85.71% of its industry peers.
- SSTK's Return On Invested Capital of 8.19% is amongst the best of the industry. SSTK outperforms 85.71% of its industry peers.
- Measured over the past 3 years, the Average Return On Invested Capital for SSTK is above the industry average of 10.42%.
- The 3 year average ROIC (15.20%) for SSTK is well above the current ROIC(8.19%). The reason for the recent decline needs to be investigated.
- SSTK's Profit Margin of 5.33% is fine compared to the rest of the industry. SSTK outperforms 72.86% of its industry peers.
- In the last couple of years the Profit Margin of SSTK has grown nicely.
- SSTK has a better Operating Margin (6.41%) than 68.57% of its industry peers.
- SSTK's Operating Margin has improved in the last couple of years.
How We Gauge Health for NYSE:SSTK
ChartMill employs its own Health Rating for stock assessment. This rating, ranging from 0 to 10, is calculated by examining various liquidity and solvency ratios. In the case of NYSE:SSTK, the assigned 5 reflects its health status:
- SSTK's Altman-Z score of 2.72 is fine compared to the rest of the industry. SSTK outperforms 68.57% of its industry peers.
- SSTK has a debt to FCF ratio of 0.86. This is a very positive value and a sign of high solvency as it would only need 0.86 years to pay back of all of its debts.
- SSTK has a Debt to FCF ratio of 0.86. This is in the better half of the industry: SSTK outperforms 78.57% of its industry peers.
- A Debt/Equity ratio of 0.06 indicates that SSTK is not too dependend on debt financing.
Understanding NYSE:SSTK's Growth Score
ChartMill assigns a proprietary Growth Rating to each stock. The score is computed by evaluating various growth aspects, like EPS and revenue growth. We take into account the history as well as the estimated future numbers. NYSE:SSTK was assigned a score of 5 for growth:
- SSTK shows a strong growth in Earnings Per Share. Measured over the last years, the EPS has been growing by 22.55% yearly.
- SSTK is expected to show quite a strong growth in Earnings Per Share. In the coming years, the EPS will grow by 10.97% yearly.
- Based on estimates for the next years, SSTK will show a quite strong growth in Revenue. The Revenue will grow by 8.69% on average per year.
- The Revenue growth rate is accelerating: in the next years the growth will be better than in the last years.
Every day, new Decent Value stocks can be found on ChartMill in our Decent Value screener.
Our latest full fundamental report of SSTK contains the most current fundamental analsysis.
Keep in mind
This article should in no way be interpreted as advice. The article is based on the observed metrics at the time of writing, but you should always make your own analysis and trade or invest at your own responsibility.