
SPORTRADAR GROUP AG-A (NASDAQ:SRAD)—A High-Growth Stock Gearing Up for Its Next Upward Move.
By Mill Chart
Last update: Mar 7, 2025
For growth-minded investors, high revenue and EPS growth are key criteria. Today, we'll examine whether SPORTRADAR GROUP AG-A (NASDAQ:SRAD) fits the bill for growth investing, particularly as it forms a base and hints at a potential breakout. Remember, due diligence is essential, but SPORTRADAR GROUP AG-A has caught our attention on our screen for growth with base formation. It may warrant additional investigation.
How We Gauge Growth for NASDAQ:SRAD
Every stock receives a Growth Rating from ChartMill, ranging from 0 to 10. This rating assesses various growth aspects, including historical and projected EPS and revenue growth. NASDAQ:SRAD boasts a 9 out of 10:
- The Earnings Per Share has grown by an impressive 575.00% over the past year.
- SRAD shows a strong growth in Earnings Per Share. Measured over the last years, the EPS has been growing by 30.72% yearly.
- Looking at the last year, SRAD shows a very strong growth in Revenue. The Revenue has grown by 26.56%.
- SRAD shows a strong growth in Revenue. Measured over the last years, the Revenue has been growing by 29.42% yearly.
- Based on estimates for the next years, SRAD will show a very strong growth in Earnings Per Share. The EPS will grow by 41.28% on average per year.
- The Revenue is expected to grow by 14.97% on average over the next years. This is quite good.
- The EPS growth rate is accelerating: in the next years the growth will be better than in the last years.
Health Assessment of NASDAQ:SRAD
ChartMill assigns a Health Rating to every stock. This score ranges from 0 to 10 and evaluates the different health aspects like liquidity and solvency, both absolutely, but also relative to the industry peers. NASDAQ:SRAD scores a 7 out of 10:
- SRAD has an Altman-Z score of 3.37. This indicates that SRAD is financially healthy and has little risk of bankruptcy at the moment.
- SRAD has a Altman-Z score of 3.37. This is amongst the best in the industry. SRAD outperforms 82.22% of its industry peers.
- The Debt to FCF ratio of SRAD is 0.36, which is an excellent value as it means it would take SRAD, only 0.36 years of fcf income to pay off all of its debts.
- With an excellent Debt to FCF ratio value of 0.36, SRAD belongs to the best of the industry, outperforming 92.59% of the companies in the same industry.
- A Debt/Equity ratio of 0.04 indicates that SRAD is not too dependend on debt financing.
- SRAD's Debt to Equity ratio of 0.04 is amongst the best of the industry. SRAD outperforms 87.41% of its industry peers.
- SRAD has a better Current ratio (1.53) than 74.81% of its industry peers.
- Looking at the Quick ratio, with a value of 1.53, SRAD is in the better half of the industry, outperforming 77.04% of the companies in the same industry.
How do we evaluate the Profitability for NASDAQ:SRAD?
ChartMill's Profitability Rating offers a unique perspective on stock analysis, providing scores from 0 to 10. These ratings consider a wide range of profitability metrics and margins, both in comparison to industry peers and on their own merits. For NASDAQ:SRAD, the assigned 6 is a significant indicator of profitability:
- The Return On Equity of SRAD (6.43%) is better than 60.74% of its industry peers.
- The 3 year average ROIC (2.22%) for SRAD is below the current ROIC(3.84%), indicating increased profibility in the last year.
- SRAD's Profit Margin has improved in the last couple of years.
- SRAD has a Gross Margin of 73.72%. This is amongst the best in the industry. SRAD outperforms 90.37% of its industry peers.
How does the Setup look for NASDAQ:SRAD
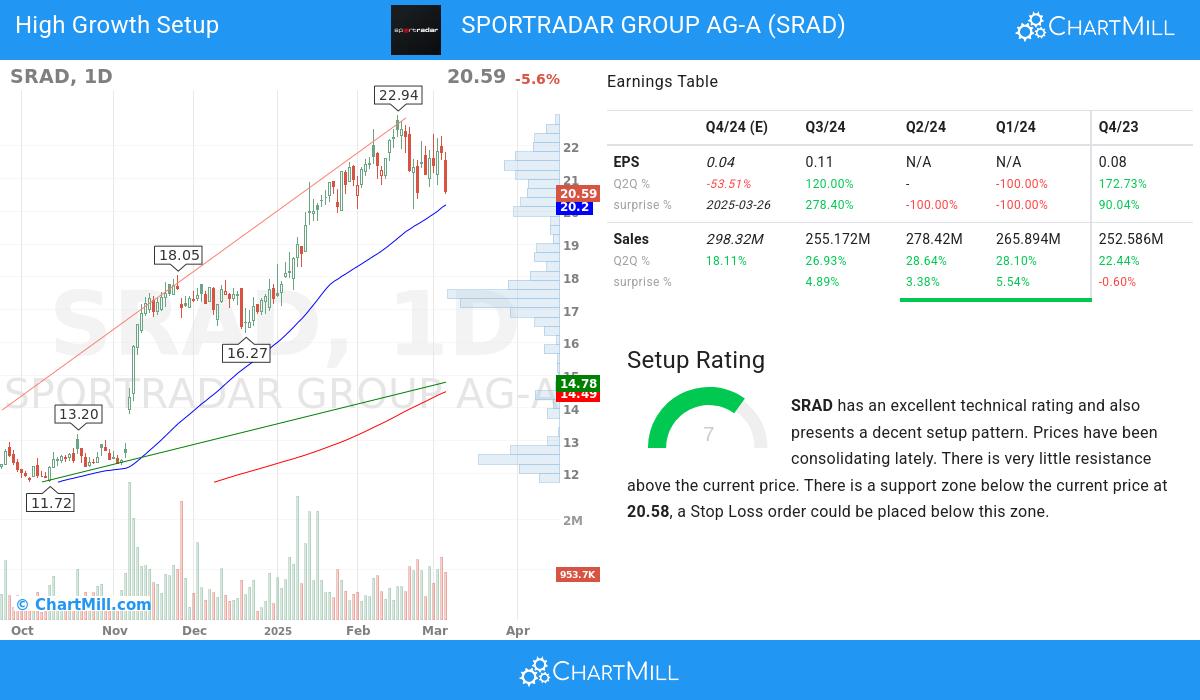
In addition to the Technical Rating, ChartMill provides a Setup Rating for each stock. This rating, ranging from 0 to 10, assesses the level of consolidation in the stock based on multiple short-term technical indicators. Currently, NASDAQ:SRAD has a 7 as its setup rating, indicating its current consolidation status.
SRAD has an excellent technical rating and also presents a decent setup pattern. Prices have been consolidating lately. There is very little resistance above the current price. There is a support zone below the current price at 20.58, a Stop Loss order could be placed below this zone.
Every day, new Strong Growth stocks can be found on ChartMill in our Strong Growth screener.
For an up to date full fundamental analysis you can check the fundamental report of SRAD
For an up to date full technical analysis you can check the technical report of SRAD
Disclaimer
This article should in no way be interpreted as advice. The article is based on the observed metrics at the time of writing, but you should always make your own analysis and trade or invest at your own responsibility.
NASDAQ:SRAD (12/19/2025, 3:01:41 PM)
23.02
+0.1 (+0.44%)
Find more stocks in the Stock Screener
SRAD Latest News and Analysis
