
Why NYSE:SQM is a Top Pick for Dividend Investors.
By Mill Chart
Last update: Sep 13, 2024
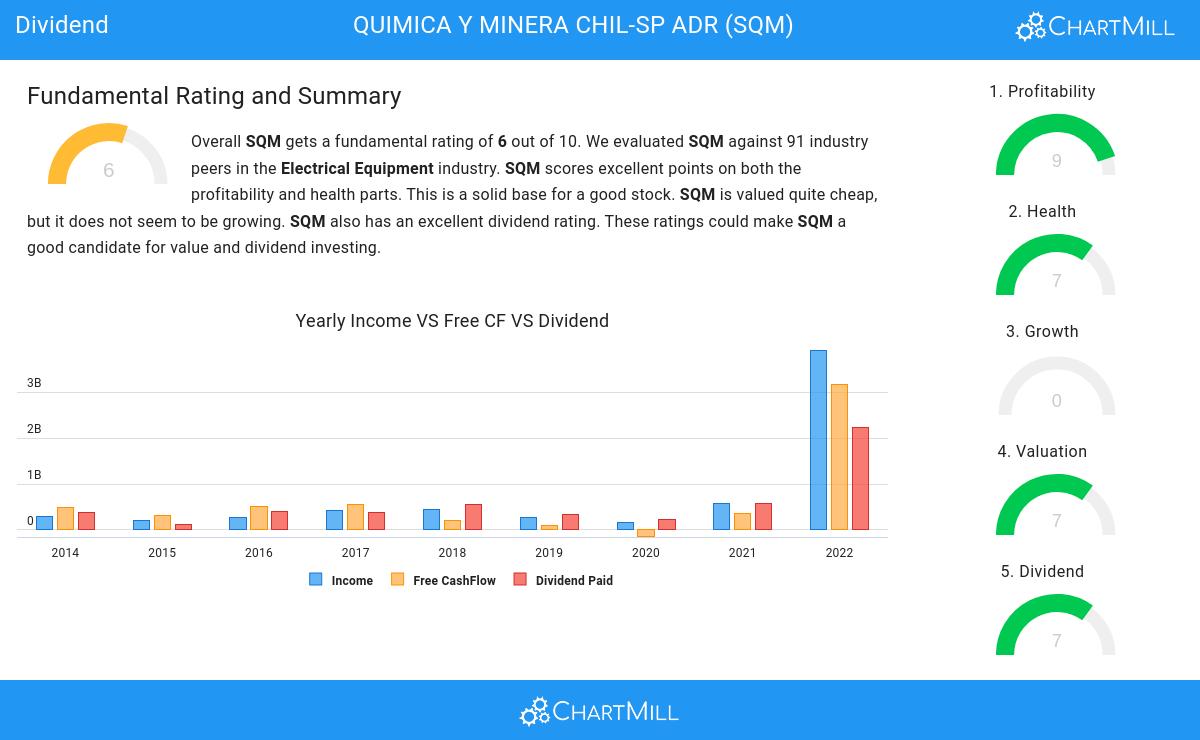
Discover QUIMICA Y MINERA CHIL-SP ADR (NYSE:SQM)—a stock that our stock screener has recognized as a solid dividend pick with strong fundamentals. NYSE:SQM showcases decent financial health and profitability while providing a sustainable dividend. We'll explore the specifics further.
What does the Dividend looks like for NYSE:SQM
To gauge a stock's dividend quality, ChartMill utilizes a Dividend Rating ranging from 0 to 10. This comprehensive assessment considers various dividend aspects, including yield, history, growth, and sustainability. NYSE:SQM has achieved a 7 out of 10:
- With a Yearly Dividend Yield of 10.90%, SQM is a good candidate for dividend investing.
- Compared to an average industry Dividend Yield of 2.38, SQM pays a better dividend. On top of this SQM pays more dividend than 100.00% of the companies listed in the same industry.
- SQM's Dividend Yield is rather good when compared to the S&P500 average which is at 2.26.
- The dividend of SQM is nicely growing with an annual growth rate of 98.58%!
- SQM has paid a dividend for at least 10 years, which is a reliable track record.
Evaluating Health: NYSE:SQM
ChartMill utilizes a Health Rating to assess stocks, scoring them on a scale of 0 to 10. This rating takes into account a variety of liquidity and solvency ratios, both in absolute terms and in comparison to industry peers. NYSE:SQM has earned a 7 out of 10:
- SQM has an Altman-Z score of 4.68. This indicates that SQM is financially healthy and has little risk of bankruptcy at the moment.
- The Altman-Z score of SQM (4.68) is better than 83.33% of its industry peers.
- The Debt to FCF ratio of SQM is 2.06, which is a good value as it means it would take SQM, 2.06 years of fcf income to pay off all of its debts.
- SQM has a better Debt to FCF ratio (2.06) than 84.44% of its industry peers.
- A Debt/Equity ratio of 0.45 indicates that SQM is not too dependend on debt financing.
- A Current Ratio of 2.48 indicates that SQM has no problem at all paying its short term obligations.
- Looking at the Current ratio, with a value of 2.48, SQM is in the better half of the industry, outperforming 66.67% of the companies in the same industry.
- SQM has a Quick ratio of 1.81. This is in the better half of the industry: SQM outperforms 68.89% of its industry peers.
Understanding NYSE:SQM's Profitability
Discover ChartMill's exclusive Profitability Rating, a proprietary metric that assesses stocks on a scale of 0 to 10. It takes into consideration various profitability ratios and margins, both in absolute terms and relative to industry peers. Notably, NYSE:SQM has achieved a 9:
- With an excellent Return On Assets value of 34.56%, SQM belongs to the best of the industry, outperforming 100.00% of the companies in the same industry.
- SQM has a Return On Equity of 71.10%. This is amongst the best in the industry. SQM outperforms 100.00% of its industry peers.
- Looking at the Return On Invested Capital, with a value of 46.56%, SQM belongs to the top of the industry, outperforming 100.00% of the companies in the same industry.
- SQM had an Average Return On Invested Capital over the past 3 years of 22.85%. This is significantly above the industry average of 11.01%.
- The 3 year average ROIC (22.85%) for SQM is below the current ROIC(46.56%), indicating increased profibility in the last year.
- SQM has a Profit Margin of 35.24%. This is amongst the best in the industry. SQM outperforms 100.00% of its industry peers.
- In the last couple of years the Profit Margin of SQM has grown nicely.
- SQM has a better Operating Margin (49.99%) than 100.00% of its industry peers.
- In the last couple of years the Operating Margin of SQM has grown nicely.
- Looking at the Gross Margin, with a value of 51.46%, SQM belongs to the top of the industry, outperforming 97.78% of the companies in the same industry.
- In the last couple of years the Gross Margin of SQM has grown nicely.
Our Best Dividend screener lists more Best Dividend stocks and is updated daily.
For an up to date full fundamental analysis you can check the fundamental report of SQM
Keep in mind
Important Note: The content of this article is not intended as trading advice. It is essential to perform your own analysis and exercise caution when making trading decisions. The article presents observations created by automated analysis but does not guarantee any trading or investment outcomes. Always trade responsibly and make independent judgments.
