
SONOCO PRODUCTS CO (NYSE:SON) has caught the attention of dividend investors as a stock worth considering. NYSE:SON excels in profitability, solvency, and liquidity, all while providing a decent dividend. Let's delve into the details.
Dividend Assessment of NYSE:SON
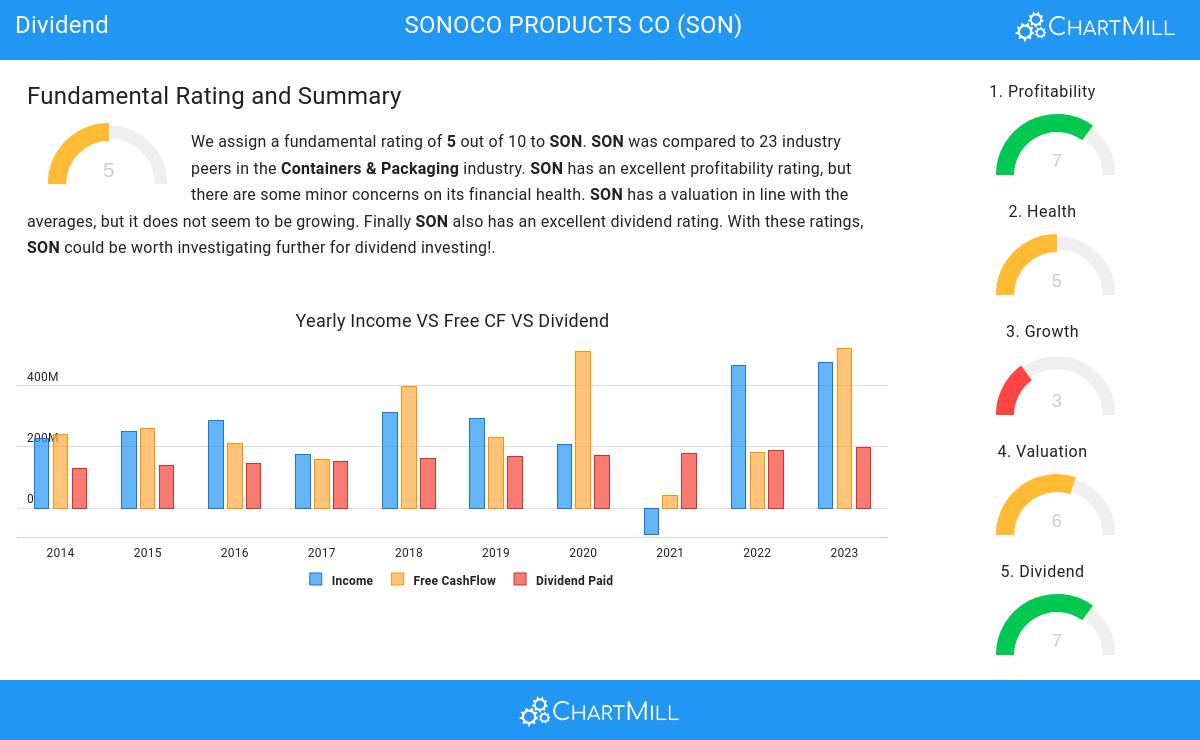
ChartMill assigns a proprietary Dividend Rating to each stock. The score is computed by evaluating various valuation aspects, like the yield, the history, the dividend growth and sustainability. NYSE:SON was assigned a score of 7 for dividend:
- SON's Dividend Yield is rather good when compared to the industry average which is at 2.99. SON pays more dividend than 82.61% of the companies in the same industry.
- SON's Dividend Yield is rather good when compared to the S&P500 average which is at 2.26.
- SON has been paying a dividend for at least 10 years, so it has a reliable track record.
- SON has not decreased its dividend for at least 10 years, so it has a reliable track record of non decreasing dividend.
ChartMill's Evaluation of Health
ChartMill assigns a Health Rating to every stock. This score ranges from 0 to 10 and evaluates the different health aspects like liquidity and solvency, both absolutely, but also relative to the industry peers. NYSE:SON scores a 5 out of 10:
- The Altman-Z score of SON (2.52) is better than 82.61% of its industry peers.
- Looking at the Debt to FCF ratio, with a value of 7.06, SON belongs to the top of the industry, outperforming 82.61% of the companies in the same industry.
- With a decent Debt to Equity ratio value of 1.04, SON is doing good in the industry, outperforming 65.22% of the companies in the same industry.
How do we evaluate the Profitability for NYSE:SON?
ChartMill assigns a Profitability Rating to every stock. This score ranges from 0 to 10 and evaluates the different profitability ratios and margins, both absolutely, but also relative to the industry peers. NYSE:SON scores a 7 out of 10:
- The Return On Assets of SON (5.14%) is better than 78.26% of its industry peers.
- SON has a better Return On Equity (15.11%) than 60.87% of its industry peers.
- SON's Return On Invested Capital of 9.24% is fine compared to the rest of the industry. SON outperforms 73.91% of its industry peers.
- Measured over the past 3 years, the Average Return On Invested Capital for SON is above the industry average of 7.89%.
- The Profit Margin of SON (5.57%) is better than 69.57% of its industry peers.
- SON's Profit Margin has improved in the last couple of years.
- The Operating Margin of SON (9.98%) is better than 60.87% of its industry peers.
- In the last couple of years the Operating Margin of SON has grown nicely.
- SON's Gross Margin has improved in the last couple of years.
Every day, new Best Dividend stocks can be found on ChartMill in our Best Dividend screener.
For an up to date full fundamental analysis you can check the fundamental report of SON
Disclaimer
This is not investing advice! The article highlights some of the observations at the time of writing, but you should always make your own analysis and invest based on your own insights.