
Is SANOFI-ADR (NASDAQ:SNY) Ready to Break Out of Its Range?
By Mill Chart
Last update: Feb 28, 2025
Our stock screener has spotted SANOFI-ADR (NASDAQ:SNY) as a possible breakout candidate. A technical breakout setup pattern occurs when the stock is consolidating after a nice uptrend. Whether the actual breakout occurs remains to be seen of course, but it may be interesting to keep an eye on NASDAQ:SNY.
Analyzing the Technical Aspects
At ChartMill, a crucial aspect of their analysis is the assignment of a Technical Rating to each stock. This rating, ranging from 0 to 10, is calculated daily by considering numerous technical indicators and properties.
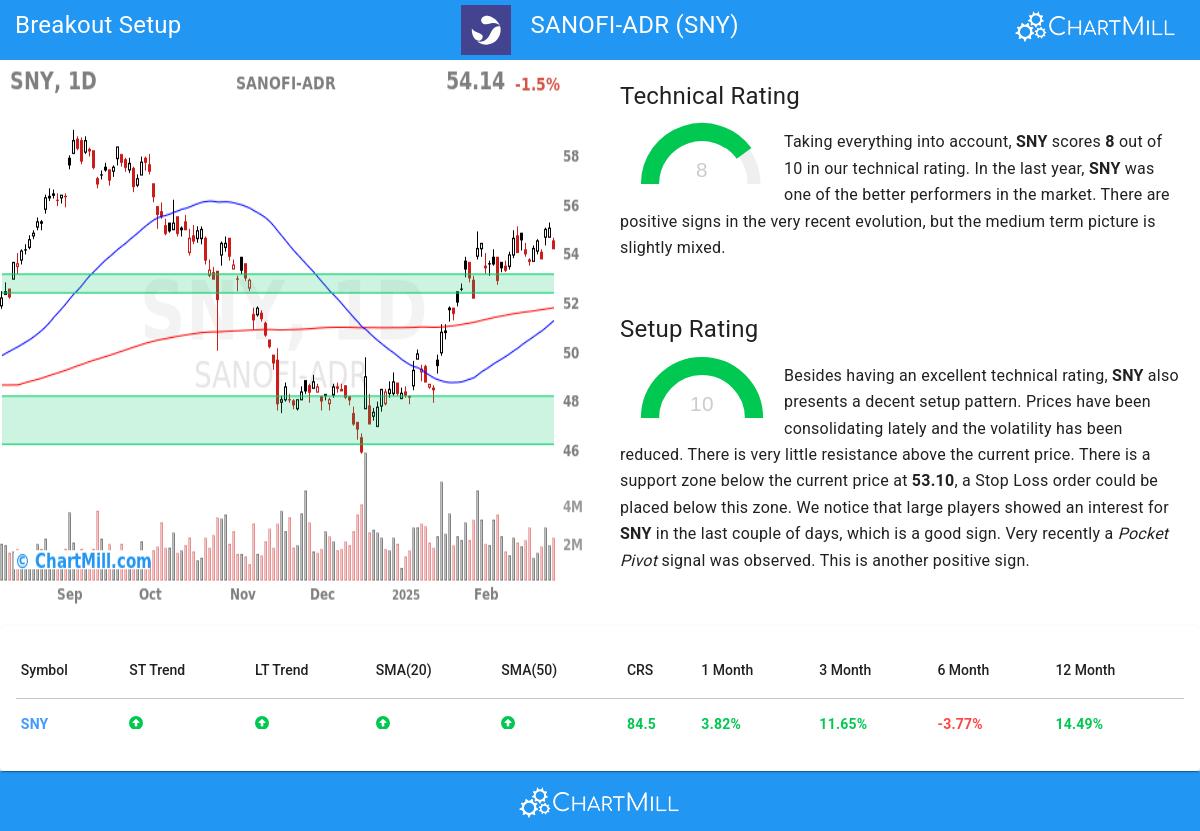
Taking everything into account, SNY scores 8 out of 10 in our technical rating. SNY has been one of the better performers in the overall market. Some doubts were observed in the medium time frame, but recent action was again very positive.
- The long and short term trends are both positive. This is looking good!
- SNY is part of the Pharmaceuticals industry. There are 193 other stocks in this industry. SNY outperforms 84% of them.
- When comparing the yearly performance of all stocks, we notice that SNY is one of the better performing stocks in the market, outperforming 84% of all stocks. However, this overall performance is mostly based on the strong move around 7 months ago.
- SNY is currently trading in the middle of its 52 week range. The S&P500 Index however is trading in the upper part of its 52 week range, so SNY is lagging the market slightly.
- In the last month SNY has a been trading in a tight range between 52.69 and 55.20.
Check the latest full technical report of SNY for a complete technical analysis.
How does the Setup look for NASDAQ:SNY
In addition to the Technical Rating, ChartMill provides a Setup Rating for each stock. This rating, ranging from 0 to 10, assesses the level of consolidation in the stock based on multiple short-term technical indicators. Currently, NASDAQ:SNY has a 10 as its setup rating, indicating its current consolidation status.
Besides having an excellent technical rating, SNY also presents a decent setup pattern. We see reduced volatility while prices have been consolidating in the most recent period. There is very little resistance above the current price. There is a support zone below the current price at 53.10, a Stop Loss order could be placed below this zone. We notice that large players showed an interest for SNY in the last couple of days, which is a good sign. Another positive sign is the recent Pocket Pivot signal.
How to trade NASDAQ:SNY?
One way to play this would be to wait for the actual breakout to happen and buy when the stock breaks out above the current consolidation zone. A possible place for a stop loss would be below this zone.
Please note that this article should not be construed as trading advice. The information provided is solely based on automated technical analysis and serves to highlight technical observations. It is important to conduct your own analysis and make trading decisions based on your own judgment and responsibility.
Every day, new breakout setups can be found on ChartMill in our Breakout screener.
Keep in mind
This article should in no way be interpreted as advice. The article is based on the observed metrics at the time of writing, but you should always make your own analysis and trade or invest at your own responsibility.
53.54
+0.52 (+0.98%)
Find more stocks in the Stock Screener
SNY Latest News and Analysis
 2 days ago - ChartmillWhy SANOFI-ADR (NASDAQ:SNY) provides a good dividend, while having solid fundamentals.
Why the dividend investor may take a look at SANOFI-ADR (NASDAQ:SNY).
