
Is NASDAQ:SNY suited for dividend investing?
By Mill Chart
Last update: Feb 26, 2025
Take a closer look at SANOFI-ADR (NASDAQ:SNY), a stock of interest to dividend investors uncovered by our stock screener. NASDAQ:SNY excels in fundamentals and provides a decent dividend, all while maintaining a reasonable valuation. Let's break it down further.
Evaluating Dividend: NASDAQ:SNY
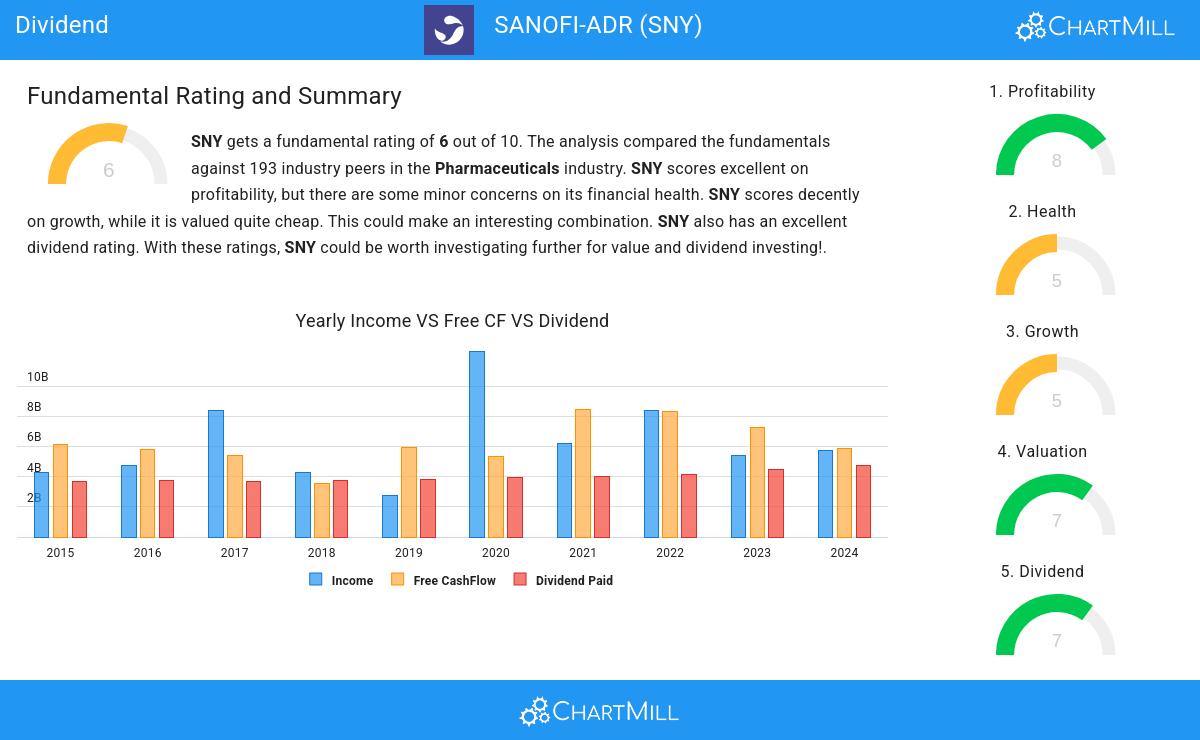
ChartMill provides a Dividend Rating for every stock, ranging from 0 to 10. This rating assesses various dividend aspects, including yield, growth, and sustainability. NASDAQ:SNY earns a 7 out of 10:
- SNY's Dividend Yield is rather good when compared to the industry average which is at 4.36. SNY pays more dividend than 94.57% of the companies in the same industry.
- Compared to an average S&P500 Dividend Yield of 2.27, SNY pays a better dividend.
- SNY has been paying a dividend for at least 10 years, so it has a reliable track record.
- 39.72% of the earnings are spent on dividend by SNY. This is a low number and sustainable payout ratio.
- SNY's earnings are growing more than its dividend. This makes the dividend growth sustainable.
Health Examination for NASDAQ:SNY
ChartMill assigns a Health Rating to every stock. This score ranges from 0 to 10 and evaluates the different health aspects like liquidity and solvency, both absolutely, but also relative to the industry peers. NASDAQ:SNY scores a 5 out of 10:
- SNY has a debt to FCF ratio of 3.04. This is a good value and a sign of high solvency as SNY would need 3.04 years to pay back of all of its debts.
- The Debt to FCF ratio of SNY (3.04) is better than 90.22% of its industry peers.
- SNY has a Debt/Equity ratio of 0.17. This is a healthy value indicating a solid balance between debt and equity.
Looking at the Profitability
Discover ChartMill's exclusive Profitability Rating, a proprietary metric that assesses stocks on a scale of 0 to 10. It takes into consideration various profitability ratios and margins, both in absolute terms and relative to industry peers. Notably, NASDAQ:SNY has achieved a 8:
- With an excellent Return On Assets value of 9.00%, SNY belongs to the best of the industry, outperforming 92.39% of the companies in the same industry.
- With an excellent Return On Equity value of 15.37%, SNY belongs to the best of the industry, outperforming 90.76% of the companies in the same industry.
- With an excellent Return On Invested Capital value of 15.58%, SNY belongs to the best of the industry, outperforming 92.39% of the companies in the same industry.
- The 3 year average ROIC (7.46%) for SNY is below the current ROIC(15.58%), indicating increased profibility in the last year.
- Looking at the Profit Margin, with a value of 12.97%, SNY belongs to the top of the industry, outperforming 88.04% of the companies in the same industry.
- SNY's Profit Margin has improved in the last couple of years.
- SNY has a better Operating Margin (22.04%) than 87.50% of its industry peers.
- SNY's Operating Margin has improved in the last couple of years.
- SNY's Gross Margin of 70.04% is fine compared to the rest of the industry. SNY outperforms 74.46% of its industry peers.
Every day, new Best Dividend stocks can be found on ChartMill in our Best Dividend screener.
For an up to date full fundamental analysis you can check the fundamental report of SNY
Disclaimer
Important Note: The content of this article is not intended as trading advice. It is essential to perform your own analysis and exercise caution when making trading decisions. The article presents observations created by automated analysis but does not guarantee any trading or investment outcomes. Always trade responsibly and make independent judgments.
