
NASDAQ:SNY is probably undervalued for the fundamentals it is displaying.
By Mill Chart
Last update: Oct 3, 2024
Consider SANOFI-ADR (NASDAQ:SNY) as a top value stock, identified by our stock screening tool. NASDAQ:SNY shines in terms of profitability, solvency, and liquidity, all while remaining very reasonably priced. Let's dive deeper into the analysis.
A Closer Look at Valuation for NASDAQ:SNY
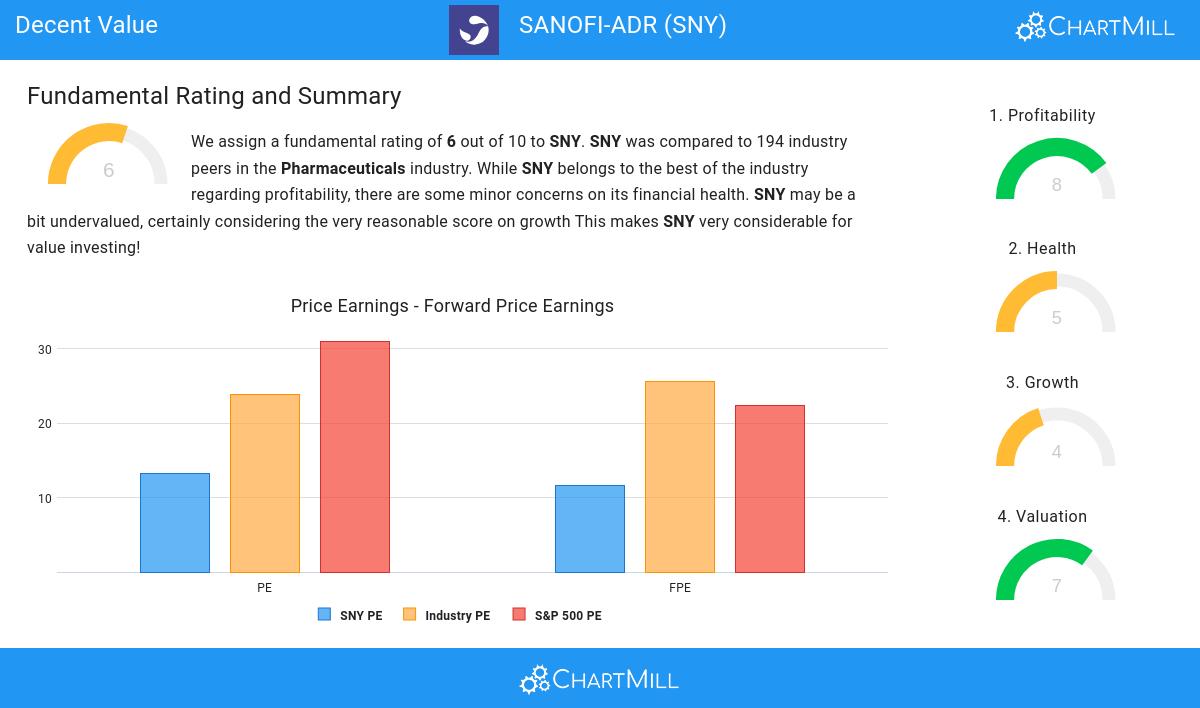
ChartMill assigns a Valuation Rating to each stock, ranging from 0 to 10. This rating is calculated by analyzing different valuation elements, such as price to earnings and free cash flow, both in absolute terms and relative to the market and industry. In the case of NASDAQ:SNY, the assigned 7 reflects its valuation:
- 90.67% of the companies in the same industry are more expensive than SNY, based on the Price/Earnings ratio.
- The average S&P500 Price/Earnings ratio is at 31.01. SNY is valued rather cheaply when compared to this.
- A Price/Forward Earnings ratio of 11.56 indicates a reasonable valuation of SNY.
- Compared to the rest of the industry, the Price/Forward Earnings ratio of SNY indicates a rather cheap valuation: SNY is cheaper than 86.01% of the companies listed in the same industry.
- Compared to an average S&P500 Price/Forward Earnings ratio of 22.36, SNY is valued a bit cheaper.
- 93.78% of the companies in the same industry are more expensive than SNY, based on the Enterprise Value to EBITDA ratio.
- 82.90% of the companies in the same industry are more expensive than SNY, based on the Price/Free Cash Flow ratio.
- The excellent profitability rating of SNY may justify a higher PE ratio.
Understanding NASDAQ:SNY's Profitability
ChartMill utilizes a Profitability Rating to assess stocks, scoring them on a scale of 0 to 10. This rating takes into account a variety of profitability ratios and margins, both in absolute terms and in comparison to industry peers. NASDAQ:SNY has earned a 8 out of 10:
- SNY has a Return On Assets of 6.07%. This is amongst the best in the industry. SNY outperforms 87.56% of its industry peers.
- SNY's Return On Equity of 10.83% is amongst the best of the industry. SNY outperforms 89.64% of its industry peers.
- SNY has a Return On Invested Capital of 12.36%. This is amongst the best in the industry. SNY outperforms 91.19% of its industry peers.
- The 3 year average ROIC (7.48%) for SNY is below the current ROIC(12.36%), indicating increased profibility in the last year.
- The Profit Margin of SNY (11.06%) is better than 87.56% of its industry peers.
- The Operating Margin of SNY (21.92%) is better than 88.60% of its industry peers.
- In the last couple of years the Operating Margin of SNY has grown nicely.
- The Gross Margin of SNY (69.08%) is better than 73.06% of its industry peers.
ChartMill's Evaluation of Health
To gauge a stock's financial health, ChartMill utilizes a Health Rating on a scale of 0 to 10. This comprehensive evaluation encompasses liquidity and solvency, both in absolute terms and in comparison to industry peers. NASDAQ:SNY has earned a 5 out of 10:
- With a decent Altman-Z score value of 2.99, SNY is doing good in the industry, outperforming 73.58% of the companies in the same industry.
- SNY has a better Debt to FCF ratio (5.74) than 86.01% of its industry peers.
- SNY has a Debt/Equity ratio of 0.20. This is a healthy value indicating a solid balance between debt and equity.
Assessing Growth for NASDAQ:SNY
ChartMill employs its own Growth Rating system for all stocks. This score, ranging from 0 to 10, is derived by evaluating different growth factors, such as EPS and revenue growth, taking into account both past performance and future projections. NASDAQ:SNY has earned a 4 for growth:
- The Earnings Per Share has been growing by 8.19% on average over the past years. This is quite good.
More Decent Value stocks can be found in our Decent Value screener.
For an up to date full fundamental analysis you can check the fundamental report of SNY
Keep in mind
Important Note: The content of this article is not intended as trading advice. It is essential to perform your own analysis and exercise caution when making trading decisions. The article presents observations created by automated analysis but does not guarantee any trading or investment outcomes. Always trade responsibly and make independent judgments.
