
Despite its impressive fundamentals, NASDAQ:SNY remains undervalued.
By Mill Chart
Last update: Sep 10, 2024
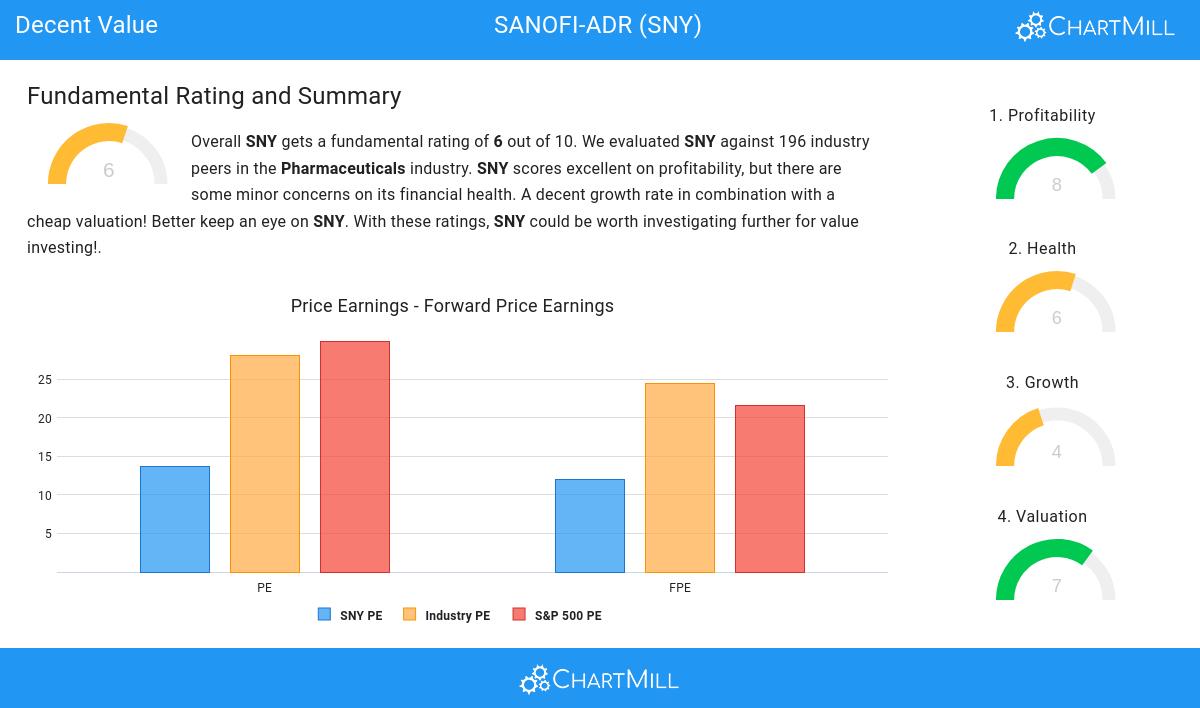
SANOFI-ADR (NASDAQ:SNY) was identified as a decent value stock by our stock screener. NASDAQ:SNY scores well on profitability, solvency and liquidity. At the same time it seems to be priced very reasonably. We'll explore this a bit deeper below.
A Closer Look at Valuation for NASDAQ:SNY
To assess a stock's valuation, ChartMill utilizes a Valuation Rating on a scale of 0 to 10. This comprehensive assessment considers various valuation aspects, comparing price to earnings and cash flows, while factoring in profitability and growth. NASDAQ:SNY has achieved a 7 out of 10:
- Based on the Price/Earnings ratio, SNY is valued cheaper than 90.26% of the companies in the same industry.
- The average S&P500 Price/Earnings ratio is at 29.93. SNY is valued rather cheaply when compared to this.
- Based on the Price/Forward Earnings ratio, SNY is valued cheaper than 85.13% of the companies in the same industry.
- SNY's Price/Forward Earnings ratio indicates a valuation a bit cheaper than the S&P500 average which is at 21.62.
- SNY's Enterprise Value to EBITDA ratio is rather cheap when compared to the industry. SNY is cheaper than 93.85% of the companies in the same industry.
- Based on the Price/Free Cash Flow ratio, SNY is valued cheaply inside the industry as 83.08% of the companies are valued more expensively.
- SNY has an outstanding profitability rating, which may justify a higher PE ratio.
Profitability Examination for NASDAQ:SNY
ChartMill assigns a proprietary Profitability Rating to each stock. The score is computed by evaluating various profitability ratios and margins and ranges from 0 to 10. NASDAQ:SNY was assigned a score of 8 for profitability:
- Looking at the Return On Assets, with a value of 6.07%, SNY belongs to the top of the industry, outperforming 87.69% of the companies in the same industry.
- SNY has a better Return On Equity (10.83%) than 89.74% of its industry peers.
- SNY has a better Return On Invested Capital (12.36%) than 91.28% of its industry peers.
- The 3 year average ROIC (7.48%) for SNY is below the current ROIC(12.36%), indicating increased profibility in the last year.
- SNY has a Profit Margin of 11.06%. This is amongst the best in the industry. SNY outperforms 87.69% of its industry peers.
- The Operating Margin of SNY (21.92%) is better than 88.72% of its industry peers.
- SNY's Operating Margin has improved in the last couple of years.
- SNY has a Gross Margin of 69.08%. This is in the better half of the industry: SNY outperforms 72.31% of its industry peers.
Evaluating Health: NASDAQ:SNY
Every stock is evaluated by ChartMill, receiving a Health Rating on a scale of 0 to 10. This assessment considers different health aspects, including liquidity and solvency, both in absolute terms and relative to industry peers. NASDAQ:SNY has achieved a 6 out of 10:
- SNY has an Altman-Z score of 3.04. This indicates that SNY is financially healthy and has little risk of bankruptcy at the moment.
- SNY has a better Altman-Z score (3.04) than 74.36% of its industry peers.
- The Debt to FCF ratio of SNY (5.74) is better than 86.15% of its industry peers.
- SNY has a Debt/Equity ratio of 0.20. This is a healthy value indicating a solid balance between debt and equity.
- SNY does not score too well on the current and quick ratio evaluation. However, as it has excellent solvency and profitability, these ratios do not necessarly indicate liquidity issues and need to be evaluated against the specifics of the business.
Growth Assessment of NASDAQ:SNY
To evaluate a stock's growth potential, ChartMill utilizes a Growth Rating on a scale of 0 to 10. This comprehensive assessment considers various growth aspects, including historical and estimated EPS and revenue growth. NASDAQ:SNY has achieved a 4 out of 10:
- Measured over the past years, SNY shows a quite strong growth in Earnings Per Share. The EPS has been growing by 8.19% on average per year.
More Decent Value stocks can be found in our Decent Value screener.
Check the latest full fundamental report of SNY for a complete fundamental analysis.
Disclaimer
Important Note: The content of this article is not intended as trading advice. It is essential to perform your own analysis and exercise caution when making trading decisions. The article presents observations created by automated analysis but does not guarantee any trading or investment outcomes. Always trade responsibly and make independent judgments.
