
NASDAQ:SMCI is not too expensive for the growth it is showing.
By Mill Chart
Last update: Dec 4, 2024
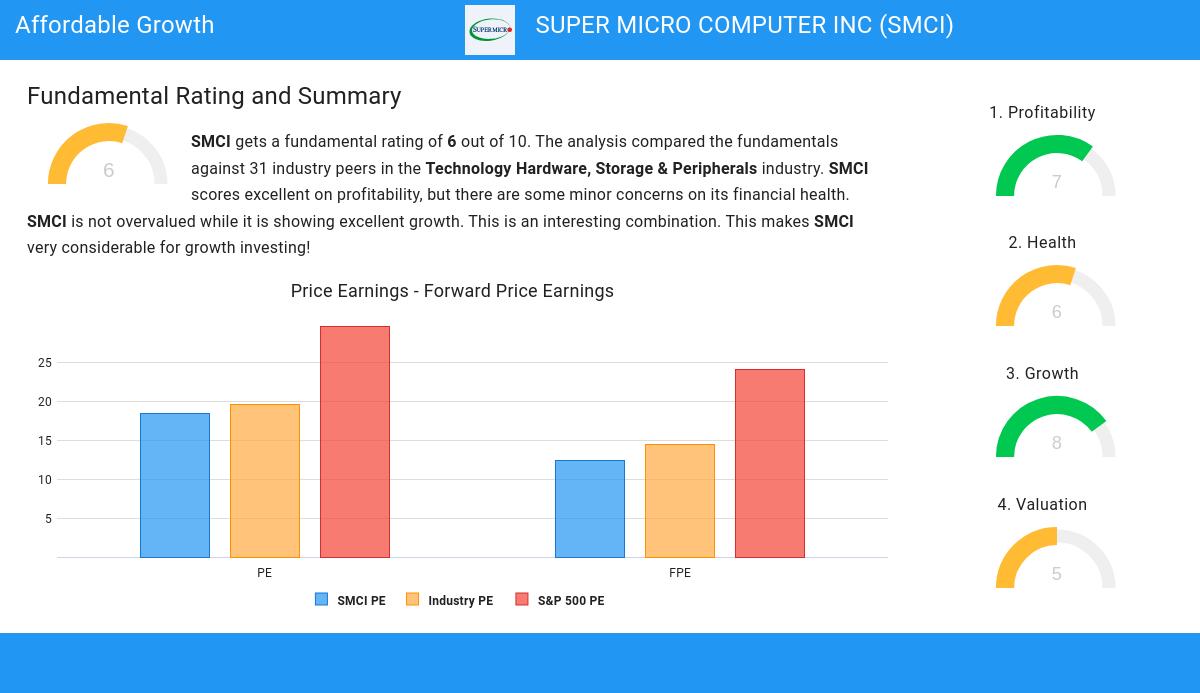
Take a closer look at SUPER MICRO COMPUTER INC (NASDAQ:SMCI), an affordable growth stock uncovered by our stock screener. NASDAQ:SMCI boasts strong growth prospects and excels in financial health indicators, all while maintaining a reasonable valuation. Let's break it down further.
Evaluating Growth: NASDAQ:SMCI
Every stock receives a Growth Rating from ChartMill, ranging from 0 to 10. This rating assesses various growth aspects, including historical and projected EPS and revenue growth. NASDAQ:SMCI boasts a 8 out of 10:
- The Earnings Per Share has grown by an impressive 85.45% over the past year.
- Measured over the past years, SMCI shows a very strong growth in Earnings Per Share. The EPS has been growing by 66.56% on average per year.
- The Revenue has grown by 109.77% in the past year. This is a very strong growth!
- Measured over the past years, SMCI shows a very strong growth in Revenue. The Revenue has been growing by 33.68% on average per year.
- Based on estimates for the next years, SMCI will show a very strong growth in Earnings Per Share. The EPS will grow by 26.47% on average per year.
- SMCI is expected to show quite a strong growth in Revenue. In the coming years, the Revenue will grow by 9.60% yearly.
Analyzing Valuation Metrics
To assess a stock's valuation, ChartMill utilizes a Valuation Rating on a scale of 0 to 10. This comprehensive assessment considers various valuation aspects, comparing price to earnings and cash flows, while factoring in profitability and growth. NASDAQ:SMCI has achieved a 5 out of 10:
- Compared to the rest of the industry, the Price/Earnings ratio of SMCI indicates a somewhat cheap valuation: SMCI is cheaper than 64.52% of the companies listed in the same industry.
- SMCI's Price/Earnings ratio indicates a valuation a bit cheaper than the S&P500 average which is at 29.61.
- Compared to the rest of the industry, the Price/Forward Earnings ratio of SMCI indicates a somewhat cheap valuation: SMCI is cheaper than 70.97% of the companies listed in the same industry.
- Compared to an average S&P500 Price/Forward Earnings ratio of 24.09, SMCI is valued a bit cheaper.
- The low PEG Ratio(NY), which compensates the Price/Earnings for growth, indicates a rather cheap valuation of the company.
- The decent profitability rating of SMCI may justify a higher PE ratio.
- A more expensive valuation may be justified as SMCI's earnings are expected to grow with 26.47% in the coming years.
Health Analysis for NASDAQ:SMCI
Every stock is evaluated by ChartMill, receiving a Health Rating on a scale of 0 to 10. This assessment considers different health aspects, including liquidity and solvency, both in absolute terms and relative to industry peers. NASDAQ:SMCI has achieved a 6 out of 10:
- An Altman-Z score of 6.73 indicates that SMCI is not in any danger for bankruptcy at the moment.
- SMCI has a Altman-Z score of 6.73. This is amongst the best in the industry. SMCI outperforms 90.32% of its industry peers.
- SMCI has a Debt/Equity ratio of 0.35. This is a healthy value indicating a solid balance between debt and equity.
- SMCI has a Current Ratio of 4.69. This indicates that SMCI is financially healthy and has no problem in meeting its short term obligations.
- SMCI has a Current ratio of 4.69. This is amongst the best in the industry. SMCI outperforms 87.10% of its industry peers.
- A Quick Ratio of 2.29 indicates that SMCI has no problem at all paying its short term obligations.
- SMCI has a better Quick ratio (2.29) than 83.87% of its industry peers.
Profitability Analysis for NASDAQ:SMCI
ChartMill's Profitability Rating offers a unique perspective on stock analysis, providing scores from 0 to 10. These ratings consider a wide range of profitability metrics and margins, both in comparison to industry peers and on their own merits. For NASDAQ:SMCI, the assigned 7 is a significant indicator of profitability:
- With an excellent Return On Assets value of 11.84%, SMCI belongs to the best of the industry, outperforming 90.32% of the companies in the same industry.
- SMCI has a Return On Equity of 20.59%. This is amongst the best in the industry. SMCI outperforms 87.10% of its industry peers.
- SMCI's Return On Invested Capital of 14.50% is fine compared to the rest of the industry. SMCI outperforms 77.42% of its industry peers.
- The Average Return On Invested Capital over the past 3 years for SMCI is significantly above the industry average of 15.82%.
- The last Return On Invested Capital (14.50%) for SMCI is well below the 3 year average (20.84%), which needs to be investigated, but indicates that SMCI had better years and this may not be a problem.
- With an excellent Profit Margin value of 8.88%, SMCI belongs to the best of the industry, outperforming 83.87% of the companies in the same industry.
- SMCI's Profit Margin has improved in the last couple of years.
- With a decent Operating Margin value of 9.72%, SMCI is doing good in the industry, outperforming 77.42% of the companies in the same industry.
- In the last couple of years the Operating Margin of SMCI has grown nicely.
Our Affordable Growth screener lists more Affordable Growth stocks and is updated daily.
Our latest full fundamental report of SMCI contains the most current fundamental analsysis.
Disclaimer
This article should in no way be interpreted as advice. The article is based on the observed metrics at the time of writing, but you should always make your own analysis and trade or invest at your own responsibility.
60.25
+4.45 (+7.97%)
Find more stocks in the Stock Screener
SMCI Latest News and Analysis
 an hour ago - ChartmillWhich S&P500 stocks are moving on Wednesday?
Let's have a look at what is happening on the US markets one hour before the close of the markets on Wednesday. Below you can find the top S&P500 gainers and losers in today's session.
 2 hours ago - ChartmillWhich S&P500 stocks are the most active on Wednesday?
Stay informed about the most active stocks in the S&P500 index on Wednesday's session. Discover the stocks that are generating the highest trading volume and driving market activity.
2 hours ago - ChartmillDiscover the most active stocks in Wednesday's session.Curious about the most active stocks in today's session? Get a glimpse into the stocks that are generating the highest trading volume and capturing market attention.
 3 hours ago - ChartmillIn today's session, there are S&P500 stocks with remarkable trading volume.
Let's take a look at the S&P500 stocks that are experiencing unusual volume in today's session.
4 hours ago - ChartmillWhat's going on in today's session: S&P500 moversUncover the latest developments among S&P500 stocks in today's session. Stay tuned to the S&P500 index's top gainers and losers on Wednesday.
a day ago - ChartmillUncover the latest developments among S&P500 stocks in today's session.Stay informed about the performance of the S&P500 index one hour before the close of the markets on Tuesday. Uncover the top gainers and losers in today's session for valuable insights.
a day ago - ChartmillWhich S&P500 stocks are the most active on Tuesday?Let's have a look at what is happening on the US markets on Tuesday. Below you can find the most active S&P500 stocks in today's session.
a day ago - ChartmillThese stocks are making the most noise in today's session.Discover the most active stocks in Tuesday's session. Stay informed about the stocks that are generating the most trading volume!
a day ago - ChartmillLet's take a look at the S&P500 stocks that are experiencing unusual volume in today's session.Let's have a look at what is happening on the US markets on Tuesday. Below you can find the S&P500 stocks with an unusual volume in today's session.
a day ago - ChartmillStay informed with the top movers within the S&P500 index on Tuesday.Wondering what's happening in today's session for the S&P500 index? Stay informed with the top movers within the S&P500 index on Tuesday.
 a day ago - ChartmillGet insights into the top movers in the S&P500 index of Tuesday's pre-market session.
Before the opening bell on Tuesday, let's take a glimpse of the US markets and explore the S&P500 top gainers and losers in today's pre-market session.
5 days ago - ChartmillWhat's going on in today's session: S&P500 moversCurious about the top performers within the S&P500 index one hour before the close of the markets on Friday? Dive into the list of today's session's top gainers and losers for a comprehensive overview.
