
Investors should take notice of NASDAQ:SMCI—it offers a great deal for the fundamentals it presents.
By Mill Chart
Last update: Nov 13, 2024
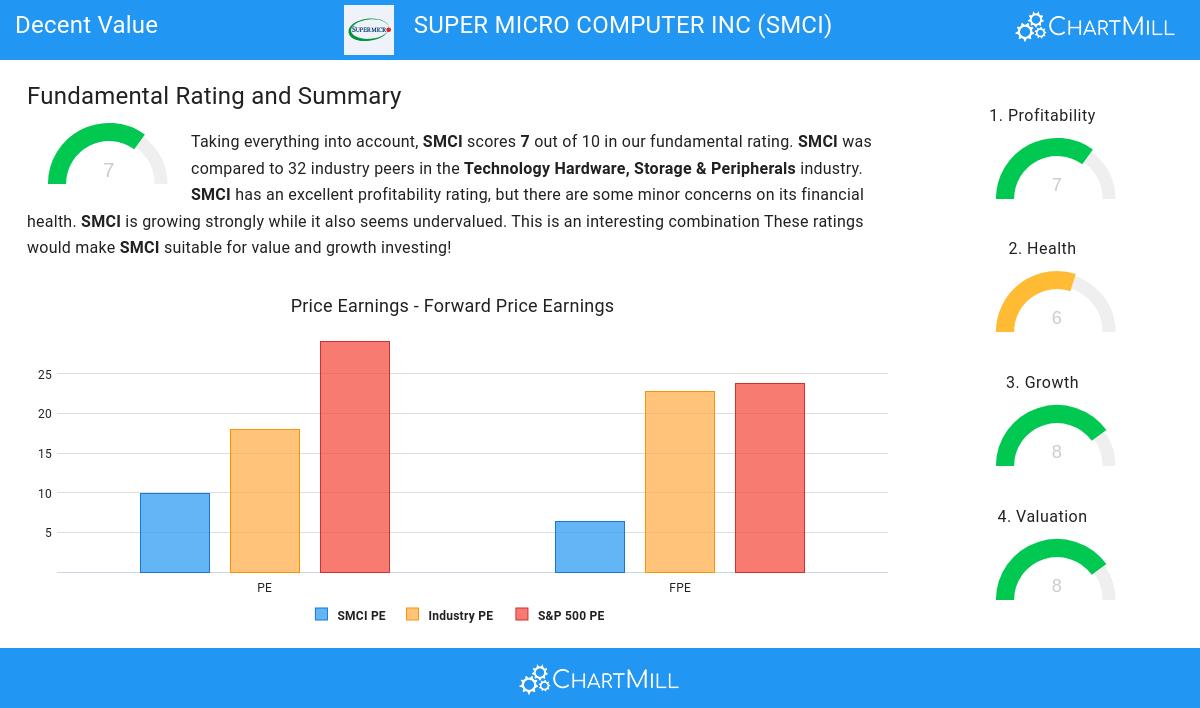
Our stock screening tool has pinpointed SUPER MICRO COMPUTER INC (NASDAQ:SMCI) as an undervalued stock. NASDAQ:SMCI maintains a solid financial footing. Furthermore, it remains attractively priced. Let's delve into the specifics below.
How do we evaluate the Valuation for NASDAQ:SMCI?
ChartMill employs its own Valuation Rating system for all stocks. This score, ranging from 0 to 10, is determined by evaluating different valuation factors, including price to earnings and free cash flow, both in absolute terms and relative to the market and industry. NASDAQ:SMCI has earned a 8 for valuation:
- The Price/Earnings ratio is 9.91, which indicates a very decent valuation of SMCI.
- Based on the Price/Earnings ratio, SMCI is valued cheaply inside the industry as 87.50% of the companies are valued more expensively.
- The average S&P500 Price/Earnings ratio is at 29.12. SMCI is valued rather cheaply when compared to this.
- With a Price/Forward Earnings ratio of 6.34, the valuation of SMCI can be described as very cheap.
- 96.88% of the companies in the same industry are more expensive than SMCI, based on the Price/Forward Earnings ratio.
- The average S&P500 Price/Forward Earnings ratio is at 23.79. SMCI is valued rather cheaply when compared to this.
- Compared to the rest of the industry, the Enterprise Value to EBITDA ratio of SMCI indicates a somewhat cheap valuation: SMCI is cheaper than 78.13% of the companies listed in the same industry.
- SMCI's low PEG Ratio(NY), which compensates the Price/Earnings for growth, indicates a rather cheap valuation of the company.
- SMCI has a very decent profitability rating, which may justify a higher PE ratio.
- A more expensive valuation may be justified as SMCI's earnings are expected to grow with 36.72% in the coming years.
What does the Profitability looks like for NASDAQ:SMCI
ChartMill's Profitability Rating offers a unique perspective on stock analysis, providing scores from 0 to 10. These ratings consider a wide range of profitability metrics and margins, both in comparison to industry peers and on their own merits. For NASDAQ:SMCI, the assigned 7 is a significant indicator of profitability:
- The Return On Assets of SMCI (11.84%) is better than 87.50% of its industry peers.
- With an excellent Return On Equity value of 20.59%, SMCI belongs to the best of the industry, outperforming 87.50% of the companies in the same industry.
- SMCI has a better Return On Invested Capital (14.50%) than 75.00% of its industry peers.
- The Average Return On Invested Capital over the past 3 years for SMCI is above the industry average of 16.81%.
- The last Return On Invested Capital (14.50%) for SMCI is well below the 3 year average (20.84%), which needs to be investigated, but indicates that SMCI had better years and this may not be a problem.
- SMCI's Profit Margin of 8.88% is amongst the best of the industry. SMCI outperforms 84.38% of its industry peers.
- In the last couple of years the Profit Margin of SMCI has grown nicely.
- With a decent Operating Margin value of 9.72%, SMCI is doing good in the industry, outperforming 78.13% of the companies in the same industry.
- In the last couple of years the Operating Margin of SMCI has grown nicely.
Analyzing Health Metrics
ChartMill employs its own Health Rating for stock assessment. This rating, ranging from 0 to 10, is calculated by examining various liquidity and solvency ratios. In the case of NASDAQ:SMCI, the assigned 6 reflects its health status:
- An Altman-Z score of 5.01 indicates that SMCI is not in any danger for bankruptcy at the moment.
- The Altman-Z score of SMCI (5.01) is better than 81.25% of its industry peers.
- A Debt/Equity ratio of 0.35 indicates that SMCI is not too dependend on debt financing.
- SMCI has a Current Ratio of 4.69. This indicates that SMCI is financially healthy and has no problem in meeting its short term obligations.
- The Current ratio of SMCI (4.69) is better than 84.38% of its industry peers.
- SMCI has a Quick Ratio of 2.29. This indicates that SMCI is financially healthy and has no problem in meeting its short term obligations.
- With an excellent Quick ratio value of 2.29, SMCI belongs to the best of the industry, outperforming 81.25% of the companies in the same industry.
Growth Assessment of NASDAQ:SMCI
ChartMill assigns a Growth Rating to each stock, ranging from 0 to 10. This rating is determined by analyzing different growth elements, including EPS and revenue growth, spanning both historical and future figures. In the case of NASDAQ:SMCI, the assigned 8 reflects its growth potential:
- The Earnings Per Share has grown by an impressive 85.45% over the past year.
- Measured over the past years, SMCI shows a very strong growth in Earnings Per Share. The EPS has been growing by 66.56% on average per year.
- Looking at the last year, SMCI shows a very strong growth in Revenue. The Revenue has grown by 109.77%.
- Measured over the past years, SMCI shows a very strong growth in Revenue. The Revenue has been growing by 33.68% on average per year.
- The Earnings Per Share is expected to grow by 36.72% on average over the next years. This is a very strong growth
- The Revenue is expected to grow by 9.60% on average over the next years. This is quite good.
Our Decent Value screener lists more Decent Value stocks and is updated daily.
Check the latest full fundamental report of SMCI for a complete fundamental analysis.
Keep in mind
This article should in no way be interpreted as advice. The article is based on the observed metrics at the time of writing, but you should always make your own analysis and trade or invest at your own responsibility.
60.25
+4.45 (+7.97%)
Find more stocks in the Stock Screener
SMCI Latest News and Analysis
 2 hours ago - ChartmillWhich S&P500 stocks are moving on Wednesday?
Let's have a look at what is happening on the US markets one hour before the close of the markets on Wednesday. Below you can find the top S&P500 gainers and losers in today's session.
 3 hours ago - ChartmillWhich S&P500 stocks are the most active on Wednesday?
Stay informed about the most active stocks in the S&P500 index on Wednesday's session. Discover the stocks that are generating the highest trading volume and driving market activity.
3 hours ago - ChartmillDiscover the most active stocks in Wednesday's session.Curious about the most active stocks in today's session? Get a glimpse into the stocks that are generating the highest trading volume and capturing market attention.
 4 hours ago - ChartmillIn today's session, there are S&P500 stocks with remarkable trading volume.
Let's take a look at the S&P500 stocks that are experiencing unusual volume in today's session.
4 hours ago - ChartmillWhat's going on in today's session: S&P500 moversUncover the latest developments among S&P500 stocks in today's session. Stay tuned to the S&P500 index's top gainers and losers on Wednesday.
a day ago - ChartmillUncover the latest developments among S&P500 stocks in today's session.Stay informed about the performance of the S&P500 index one hour before the close of the markets on Tuesday. Uncover the top gainers and losers in today's session for valuable insights.
a day ago - ChartmillWhich S&P500 stocks are the most active on Tuesday?Let's have a look at what is happening on the US markets on Tuesday. Below you can find the most active S&P500 stocks in today's session.
a day ago - ChartmillThese stocks are making the most noise in today's session.Discover the most active stocks in Tuesday's session. Stay informed about the stocks that are generating the most trading volume!
a day ago - ChartmillLet's take a look at the S&P500 stocks that are experiencing unusual volume in today's session.Let's have a look at what is happening on the US markets on Tuesday. Below you can find the S&P500 stocks with an unusual volume in today's session.
a day ago - ChartmillStay informed with the top movers within the S&P500 index on Tuesday.Wondering what's happening in today's session for the S&P500 index? Stay informed with the top movers within the S&P500 index on Tuesday.
 a day ago - ChartmillGet insights into the top movers in the S&P500 index of Tuesday's pre-market session.
Before the opening bell on Tuesday, let's take a glimpse of the US markets and explore the S&P500 top gainers and losers in today's pre-market session.
5 days ago - ChartmillWhat's going on in today's session: S&P500 moversCurious about the top performers within the S&P500 index one hour before the close of the markets on Friday? Dive into the list of today's session's top gainers and losers for a comprehensive overview.
