
NASDAQ:SMCI stands out as a growth opportunity that won't break the bank.
By Mill Chart
Last update: Nov 8, 2024
Our stock screener has singled out SUPER MICRO COMPUTER INC (NASDAQ:SMCI) as an attractive growth opportunity. NASDAQ:SMCI is demonstrating remarkable growth potential while maintaining strong financial indicators, making it a reasonably priced option. We'll explore this further.
Growth Assessment of NASDAQ:SMCI
To evaluate a stock's growth potential, ChartMill utilizes a Growth Rating on a scale of 0 to 10. This comprehensive assessment considers various growth aspects, including historical and estimated EPS and revenue growth. NASDAQ:SMCI has achieved a 8 out of 10:
- The Earnings Per Share has grown by an impressive 85.45% over the past year.
- The Earnings Per Share has been growing by 66.56% on average over the past years. This is a very strong growth
- The Revenue has grown by 109.77% in the past year. This is a very strong growth!
- Measured over the past years, SMCI shows a very strong growth in Revenue. The Revenue has been growing by 33.68% on average per year.
- SMCI is expected to show a strong growth in Earnings Per Share. In the coming years, the EPS will grow by 36.72% yearly.
- SMCI is expected to show quite a strong growth in Revenue. In the coming years, the Revenue will grow by 9.60% yearly.
Valuation Assessment of NASDAQ:SMCI
ChartMill provides a Valuation Rating to every stock, ranging from 0 to 10. This rating assesses various valuation aspects, comparing price to earnings and cash flows, while considering factors like profitability and growth. NASDAQ:SMCI boasts a 8 out of 10:
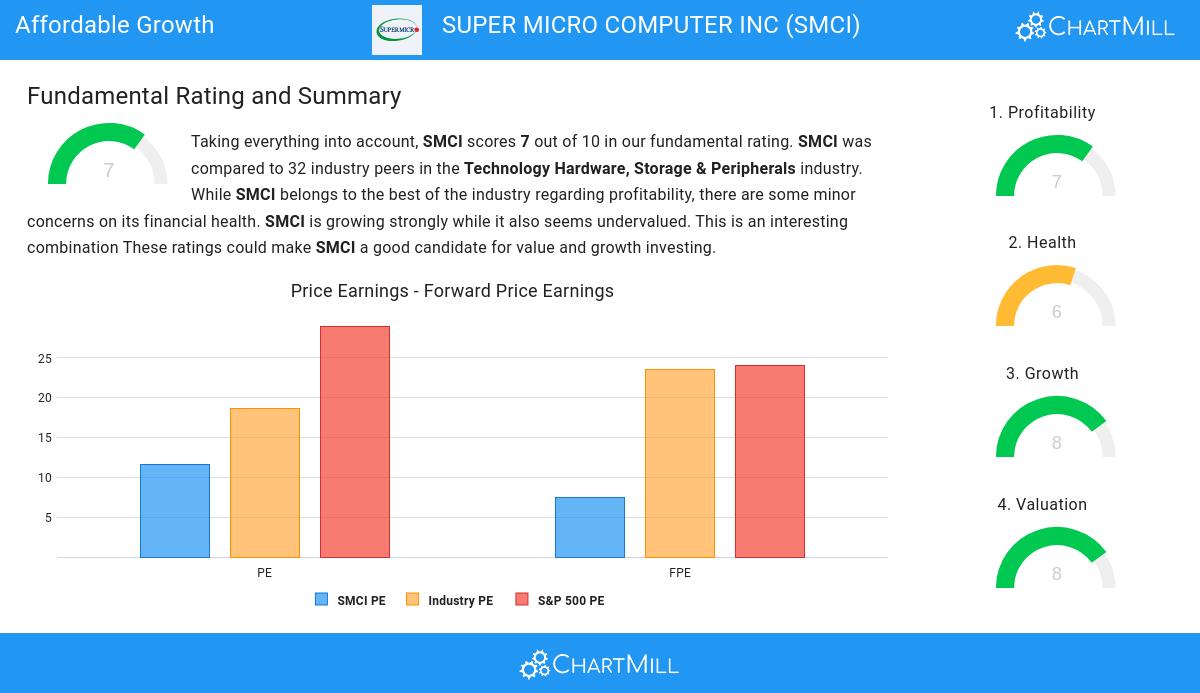
- Based on the Price/Earnings ratio of 11.63, the valuation of SMCI can be described as reasonable.
- Based on the Price/Earnings ratio, SMCI is valued cheaply inside the industry as 81.25% of the companies are valued more expensively.
- SMCI is valuated cheaply when we compare the Price/Earnings ratio to 28.94, which is the current average of the S&P500 Index.
- With a Price/Forward Earnings ratio of 7.44, the valuation of SMCI can be described as very cheap.
- 93.75% of the companies in the same industry are more expensive than SMCI, based on the Price/Forward Earnings ratio.
- The average S&P500 Price/Forward Earnings ratio is at 24.03. SMCI is valued rather cheaply when compared to this.
- Based on the Enterprise Value to EBITDA ratio, SMCI is valued a bit cheaper than 75.00% of the companies in the same industry.
- SMCI's low PEG Ratio(NY), which compensates the Price/Earnings for growth, indicates a rather cheap valuation of the company.
- SMCI has a very decent profitability rating, which may justify a higher PE ratio.
- SMCI's earnings are expected to grow with 36.72% in the coming years. This may justify a more expensive valuation.
A Closer Look at Health for NASDAQ:SMCI
A critical element of ChartMill's stock evaluation is the Health Rating, which spans from 0 to 10. This rating considers multiple health factors, including liquidity and solvency, both in absolute terms and relative to industry peers. NASDAQ:SMCI has received a 6 out of 10:
- SMCI has an Altman-Z score of 5.36. This indicates that SMCI is financially healthy and has little risk of bankruptcy at the moment.
- Looking at the Altman-Z score, with a value of 5.36, SMCI belongs to the top of the industry, outperforming 84.38% of the companies in the same industry.
- A Debt/Equity ratio of 0.35 indicates that SMCI is not too dependend on debt financing.
- A Current Ratio of 4.69 indicates that SMCI has no problem at all paying its short term obligations.
- SMCI has a Current ratio of 4.69. This is amongst the best in the industry. SMCI outperforms 84.38% of its industry peers.
- SMCI has a Quick Ratio of 2.29. This indicates that SMCI is financially healthy and has no problem in meeting its short term obligations.
- SMCI has a Quick ratio of 2.29. This is in the better half of the industry: SMCI outperforms 78.13% of its industry peers.
Profitability Assessment of NASDAQ:SMCI
ChartMill assigns a proprietary Profitability Rating to each stock. The score is computed by evaluating various profitability ratios and margins and ranges from 0 to 10. NASDAQ:SMCI was assigned a score of 7 for profitability:
- With an excellent Return On Assets value of 11.84%, SMCI belongs to the best of the industry, outperforming 84.38% of the companies in the same industry.
- SMCI's Return On Equity of 20.59% is amongst the best of the industry. SMCI outperforms 84.38% of its industry peers.
- The Return On Invested Capital of SMCI (14.50%) is better than 75.00% of its industry peers.
- SMCI had an Average Return On Invested Capital over the past 3 years of 20.84%. This is above the industry average of 16.75%.
- The last Return On Invested Capital (14.50%) for SMCI is well below the 3 year average (20.84%), which needs to be investigated, but indicates that SMCI had better years and this may not be a problem.
- Looking at the Profit Margin, with a value of 8.88%, SMCI belongs to the top of the industry, outperforming 81.25% of the companies in the same industry.
- In the last couple of years the Profit Margin of SMCI has grown nicely.
- SMCI has a Operating Margin of 9.72%. This is in the better half of the industry: SMCI outperforms 78.13% of its industry peers.
- In the last couple of years the Operating Margin of SMCI has grown nicely.
Every day, new Affordable Growth stocks can be found on ChartMill in our Affordable Growth screener.
For an up to date full fundamental analysis you can check the fundamental report of SMCI
Disclaimer
This article should in no way be interpreted as advice. The article is based on the observed metrics at the time of writing, but you should always make your own analysis and trade or invest at your own responsibility.
60.25
+4.45 (+7.97%)
Find more stocks in the Stock Screener
SMCI Latest News and Analysis
 an hour ago - ChartmillWhich S&P500 stocks are moving on Wednesday?
Let's have a look at what is happening on the US markets one hour before the close of the markets on Wednesday. Below you can find the top S&P500 gainers and losers in today's session.
 2 hours ago - ChartmillWhich S&P500 stocks are the most active on Wednesday?
Stay informed about the most active stocks in the S&P500 index on Wednesday's session. Discover the stocks that are generating the highest trading volume and driving market activity.
2 hours ago - ChartmillDiscover the most active stocks in Wednesday's session.Curious about the most active stocks in today's session? Get a glimpse into the stocks that are generating the highest trading volume and capturing market attention.
 3 hours ago - ChartmillIn today's session, there are S&P500 stocks with remarkable trading volume.
Let's take a look at the S&P500 stocks that are experiencing unusual volume in today's session.
4 hours ago - ChartmillWhat's going on in today's session: S&P500 moversUncover the latest developments among S&P500 stocks in today's session. Stay tuned to the S&P500 index's top gainers and losers on Wednesday.
a day ago - ChartmillUncover the latest developments among S&P500 stocks in today's session.Stay informed about the performance of the S&P500 index one hour before the close of the markets on Tuesday. Uncover the top gainers and losers in today's session for valuable insights.
a day ago - ChartmillWhich S&P500 stocks are the most active on Tuesday?Let's have a look at what is happening on the US markets on Tuesday. Below you can find the most active S&P500 stocks in today's session.
a day ago - ChartmillThese stocks are making the most noise in today's session.Discover the most active stocks in Tuesday's session. Stay informed about the stocks that are generating the most trading volume!
a day ago - ChartmillLet's take a look at the S&P500 stocks that are experiencing unusual volume in today's session.Let's have a look at what is happening on the US markets on Tuesday. Below you can find the S&P500 stocks with an unusual volume in today's session.
a day ago - ChartmillStay informed with the top movers within the S&P500 index on Tuesday.Wondering what's happening in today's session for the S&P500 index? Stay informed with the top movers within the S&P500 index on Tuesday.
 a day ago - ChartmillGet insights into the top movers in the S&P500 index of Tuesday's pre-market session.
Before the opening bell on Tuesday, let's take a glimpse of the US markets and explore the S&P500 top gainers and losers in today's pre-market session.
5 days ago - ChartmillWhat's going on in today's session: S&P500 moversCurious about the top performers within the S&P500 index one hour before the close of the markets on Friday? Dive into the list of today's session's top gainers and losers for a comprehensive overview.
