
Don't overlook NASDAQ:SMCI—a stock with solid growth prospects and a reasonable valuation.
By Mill Chart
Last update: Sep 4, 2024
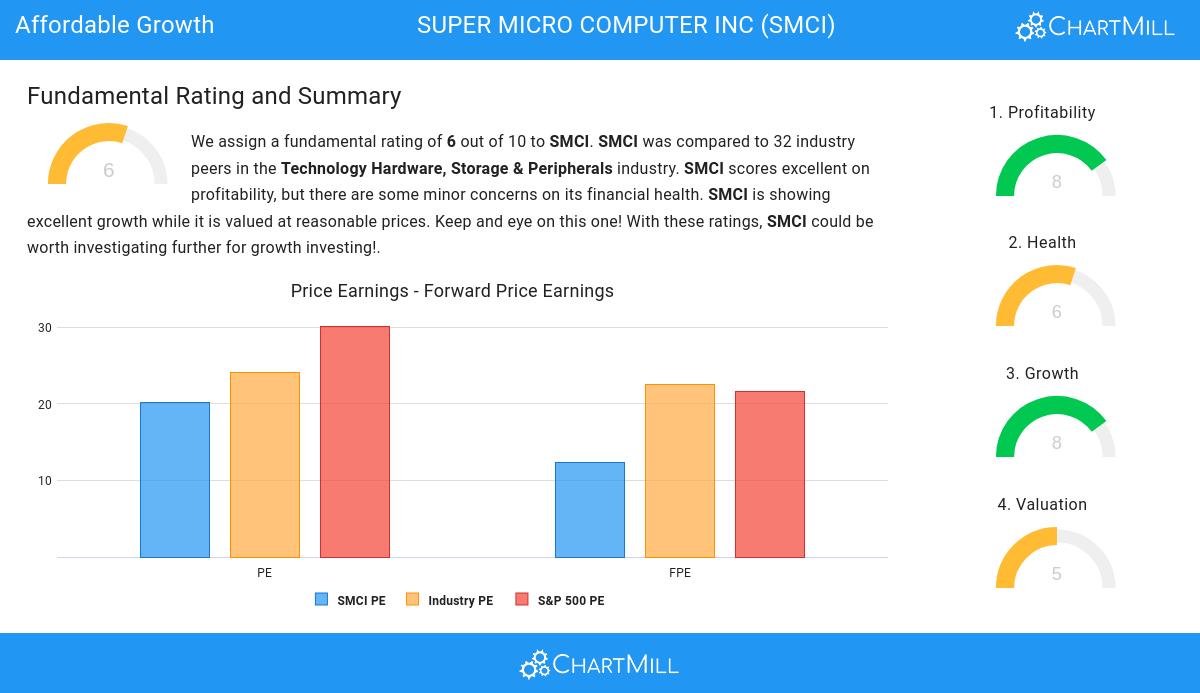
SUPER MICRO COMPUTER INC (NASDAQ:SMCI) has caught the eye of our stock screener as an affordable growth stock. NASDAQ:SMCI is displaying robust growth metrics and also excels in terms of profitability, solvency, and liquidity. Additionally, it appears to be reasonably priced. Let's delve into the details.
Growth Analysis for NASDAQ:SMCI
Every stock receives a Growth Rating from ChartMill, ranging from 0 to 10. This rating assesses various growth aspects, including historical and projected EPS and revenue growth. NASDAQ:SMCI boasts a 8 out of 10:
- The Earnings Per Share has grown by an impressive 85.45% over the past year.
- Measured over the past years, SMCI shows a very strong growth in Earnings Per Share. The EPS has been growing by 66.56% on average per year.
- Looking at the last year, SMCI shows a very strong growth in Revenue. The Revenue has grown by 109.77%.
- The Revenue has been growing by 33.68% on average over the past years. This is a very strong growth!
- The Earnings Per Share is expected to grow by 35.81% on average over the next years. This is a very strong growth
- The Revenue is expected to grow by 9.60% on average over the next years. This is quite good.
Valuation Assessment of NASDAQ:SMCI
ChartMill assigns a Valuation Rating to each stock, ranging from 0 to 10. This rating is calculated by analyzing different valuation elements, such as price to earnings and free cash flow, both in absolute terms and relative to the market and industry. In the case of NASDAQ:SMCI, the assigned 5 reflects its valuation:
- When comparing the Price/Earnings ratio of SMCI to the average of the S&P500 Index (30.14), we can say SMCI is valued slightly cheaper.
- SMCI's Price/Forward Earnings ratio is a bit cheaper when compared to the industry. SMCI is cheaper than 62.50% of the companies in the same industry.
- Compared to an average S&P500 Price/Forward Earnings ratio of 21.56, SMCI is valued a bit cheaper.
- 62.50% of the companies in the same industry are more expensive than SMCI, based on the Enterprise Value to EBITDA ratio.
- The low PEG Ratio(NY), which compensates the Price/Earnings for growth, indicates a rather cheap valuation of the company.
- SMCI has an outstanding profitability rating, which may justify a higher PE ratio.
- A more expensive valuation may be justified as SMCI's earnings are expected to grow with 35.81% in the coming years.
Assessing Health for NASDAQ:SMCI
ChartMill assigns a proprietary Health Rating to each stock. The score is computed by evaluating various liquidity and solvency ratios and ranges from 0 to 10. NASDAQ:SMCI was assigned a score of 6 for health:
- SMCI has an Altman-Z score of 7.10. This indicates that SMCI is financially healthy and has little risk of bankruptcy at the moment.
- The Altman-Z score of SMCI (7.10) is better than 90.63% of its industry peers.
- A Debt/Equity ratio of 0.35 indicates that SMCI is not too dependend on debt financing.
- A Current Ratio of 4.69 indicates that SMCI has no problem at all paying its short term obligations.
- Looking at the Current ratio, with a value of 4.69, SMCI belongs to the top of the industry, outperforming 84.38% of the companies in the same industry.
- A Quick Ratio of 2.29 indicates that SMCI has no problem at all paying its short term obligations.
- SMCI has a Quick ratio of 2.29. This is in the better half of the industry: SMCI outperforms 75.00% of its industry peers.
Profitability Insights: NASDAQ:SMCI
ChartMill utilizes a Profitability Rating to assess stocks, scoring them on a scale of 0 to 10. This rating takes into account a variety of profitability ratios and margins, both in absolute terms and in comparison to industry peers. NASDAQ:SMCI has earned a 8 out of 10:
- Looking at the Return On Assets, with a value of 11.84%, SMCI belongs to the top of the industry, outperforming 84.38% of the companies in the same industry.
- The Return On Equity of SMCI (20.59%) is better than 84.38% of its industry peers.
- Looking at the Return On Invested Capital, with a value of 14.50%, SMCI belongs to the top of the industry, outperforming 81.25% of the companies in the same industry.
- SMCI had an Average Return On Invested Capital over the past 3 years of 20.84%. This is above the industry average of 16.69%.
- The last Return On Invested Capital (14.50%) for SMCI is well below the 3 year average (20.84%), which needs to be investigated, but indicates that SMCI had better years and this may not be a problem.
- SMCI has a better Profit Margin (8.88%) than 84.38% of its industry peers.
- In the last couple of years the Profit Margin of SMCI has grown nicely.
- Looking at the Operating Margin, with a value of 9.72%, SMCI belongs to the top of the industry, outperforming 81.25% of the companies in the same industry.
- In the last couple of years the Operating Margin of SMCI has grown nicely.
Our Affordable Growth screener lists more Affordable Growth stocks and is updated daily.
Our latest full fundamental report of SMCI contains the most current fundamental analsysis.
Keep in mind
Important Note: The content of this article is not intended as trading advice. It is essential to perform your own analysis and exercise caution when making trading decisions. The article presents observations created by automated analysis but does not guarantee any trading or investment outcomes. Always trade responsibly and make independent judgments.
56.07
-3.2 (-5.4%)
Find more stocks in the Stock Screener
SMCI Latest News and Analysis
 a day ago - ChartmillThese S&P500 stocks are the most active in today's session
Let's have a look at what is happening on the US markets on Friday. Below you can find the most active S&P500 stocks in today's session.
2 days ago - ChartmillCurious about the most active S&P500 stocks in today's session?Explore the S&P500 index on Thursday and find out which stocks are the most active in today's session. Stay updated with the stocks that are capturing market interest and driving market movements.
2 days ago - ChartmillThursday's session: most active stocksThese stocks are making the most noise in today's session. Stay tuned for the latest updates!
 2 days ago - ChartmillWhich S&P500 stocks have an unusual volume on Thursday?
Let's have a look at the S&P500 stocks with an unusual volume in today's session.
 2 days ago - ChartmillWhat's going on in today's session: S&P500 gap up and gap down stocks
Let's have a look at the S&P500 gap up and gap down stocks in today's session.
 2 days ago - ChartmillWhich S&P500 stocks are moving before the opening bell on Thursday?
As the US market prepares to open on Thursday, let's get an early glimpse into the pre-market session and identify the S&P500 stocks leading the pack in terms of gains and losses.
 3 days ago - ChartmillWhich S&P500 stocks are moving on Wednesday?
Let's have a look at what is happening on the US markets one hour before the close of the markets on Wednesday. Below you can find the top S&P500 gainers and losers in today's session.
3 days ago - ChartmillWhich S&P500 stocks are the most active on Wednesday?Stay informed about the most active stocks in the S&P500 index on Wednesday's session. Discover the stocks that are generating the highest trading volume and driving market activity.
3 days ago - ChartmillDiscover the most active stocks in Wednesday's session.Curious about the most active stocks in today's session? Get a glimpse into the stocks that are generating the highest trading volume and capturing market attention.
3 days ago - ChartmillIn today's session, there are S&P500 stocks with remarkable trading volume.Let's take a look at the S&P500 stocks that are experiencing unusual volume in today's session.
3 days ago - ChartmillWhat's going on in today's session: S&P500 moversUncover the latest developments among S&P500 stocks in today's session. Stay tuned to the S&P500 index's top gainers and losers on Wednesday.
4 days ago - ChartmillUncover the latest developments among S&P500 stocks in today's session.Stay informed about the performance of the S&P500 index one hour before the close of the markets on Tuesday. Uncover the top gainers and losers in today's session for valuable insights.
