
NYSE:SM is probably undervalued for the fundamentals it is displaying.
By Mill Chart
Last update: Sep 19, 2024
Uncover the potential of SM ENERGY CO (NYSE:SM) as our stock screener's choice for an undervalued stock. NYSE:SM maintains a strong financial position and offers an appealing valuation. We'll delve into the specifics below.
How We Gauge Valuation for NYSE:SM
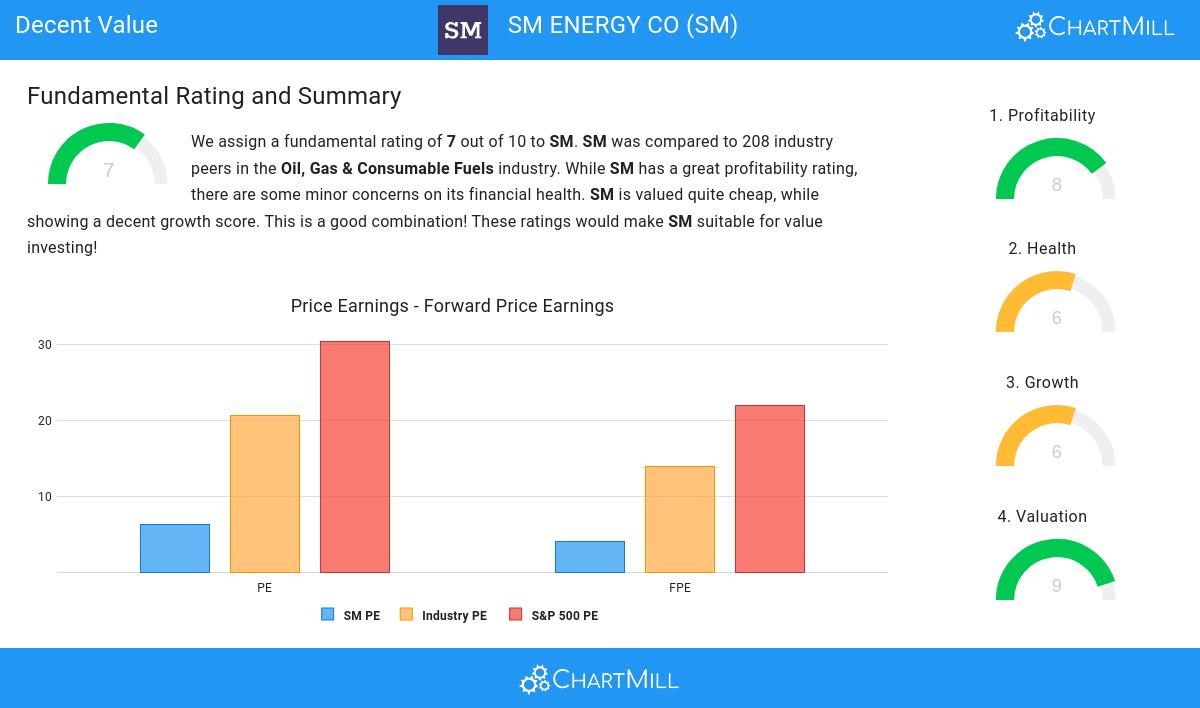
ChartMill assigns a proprietary Valuation Rating to each stock. The score is computed by evaluating various valuation aspects, like price to earnings and free cash flow, both absolutely as relative to the market and industry. NYSE:SM was assigned a score of 9 for valuation:
- A Price/Earnings ratio of 6.22 indicates a rather cheap valuation of SM.
- Based on the Price/Earnings ratio, SM is valued cheaper than 82.21% of the companies in the same industry.
- Compared to an average S&P500 Price/Earnings ratio of 30.45, SM is valued rather cheaply.
- A Price/Forward Earnings ratio of 3.96 indicates a rather cheap valuation of SM.
- Based on the Price/Forward Earnings ratio, SM is valued cheaper than 94.71% of the companies in the same industry.
- When comparing the Price/Forward Earnings ratio of SM to the average of the S&P500 Index (21.99), we can say SM is valued rather cheaply.
- Compared to the rest of the industry, the Enterprise Value to EBITDA ratio of SM indicates a rather cheap valuation: SM is cheaper than 82.21% of the companies listed in the same industry.
- 65.87% of the companies in the same industry are more expensive than SM, based on the Price/Free Cash Flow ratio.
- SM's low PEG Ratio(NY), which compensates the Price/Earnings for growth, indicates a rather cheap valuation of the company.
- SM has an outstanding profitability rating, which may justify a higher PE ratio.
- A more expensive valuation may be justified as SM's earnings are expected to grow with 19.88% in the coming years.
A Closer Look at Profitability for NYSE:SM
ChartMill assigns a proprietary Profitability Rating to each stock. The score is computed by evaluating various profitability ratios and margins and ranges from 0 to 10. NYSE:SM was assigned a score of 8 for profitability:
- SM has a Return On Assets of 12.18%. This is amongst the best in the industry. SM outperforms 80.29% of its industry peers.
- With a decent Return On Equity value of 21.10%, SM is doing good in the industry, outperforming 72.60% of the companies in the same industry.
- Looking at the Return On Invested Capital, with a value of 13.61%, SM is in the better half of the industry, outperforming 76.92% of the companies in the same industry.
- The 3 year average ROIC (22.74%) for SM is well above the current ROIC(13.61%). The reason for the recent decline needs to be investigated.
- With an excellent Profit Margin value of 33.18%, SM belongs to the best of the industry, outperforming 81.73% of the companies in the same industry.
- SM's Profit Margin has improved in the last couple of years.
- The Operating Margin of SM (39.86%) is better than 77.88% of its industry peers.
- In the last couple of years the Operating Margin of SM has grown nicely.
- Looking at the Gross Margin, with a value of 77.51%, SM belongs to the top of the industry, outperforming 87.50% of the companies in the same industry.
- SM's Gross Margin has improved in the last couple of years.
Health Insights: NYSE:SM
Every stock is evaluated by ChartMill, receiving a Health Rating on a scale of 0 to 10. This assessment considers different health aspects, including liquidity and solvency, both in absolute terms and relative to industry peers. NYSE:SM has achieved a 6 out of 10:
- SM has a better Altman-Z score (2.38) than 66.35% of its industry peers.
- SM has a debt to FCF ratio of 3.18. This is a good value and a sign of high solvency as SM would need 3.18 years to pay back of all of its debts.
- SM's Debt to FCF ratio of 3.18 is fine compared to the rest of the industry. SM outperforms 69.71% of its industry peers.
- SM has a Debt/Equity ratio of 0.41. This is a healthy value indicating a solid balance between debt and equity.
- Looking at the Quick ratio, with a value of 1.29, SM is in the better half of the industry, outperforming 63.46% of the companies in the same industry.
Understanding NYSE:SM's Growth Score
ChartMill assigns a Growth Rating to each stock, ranging from 0 to 10. This rating is determined by analyzing different growth elements, including EPS and revenue growth, spanning both historical and future figures. In the case of NYSE:SM, the assigned 6 reflects its growth potential:
- The Earnings Per Share has grown by an nice 15.03% over the past year.
- Measured over the past years, SM shows a very strong growth in Earnings Per Share. The EPS has been growing by 187.86% on average per year.
- SM is expected to show quite a strong growth in Earnings Per Share. In the coming years, the EPS will grow by 10.07% yearly.
- SM is expected to show quite a strong growth in Revenue. In the coming years, the Revenue will grow by 13.17% yearly.
- When comparing the Revenue growth rate of the last years to the growth rate of the upcoming years, we see that the growth is accelerating.
Our Decent Value screener lists more Decent Value stocks and is updated daily.
Our latest full fundamental report of SM contains the most current fundamental analsysis.
Keep in mind
This article should in no way be interpreted as advice. The article is based on the observed metrics at the time of writing, but you should always make your own analysis and trade or invest at your own responsibility.
