
Discover SCHLUMBERGER LTD (NYSE:SLB)—an undervalued stock our stock screener has picked out. NYSE:SLB demonstrates solid fundamentals, including health and profitability, all while staying attractively priced. Let's explore the details.
ChartMill's Evaluation of Valuation
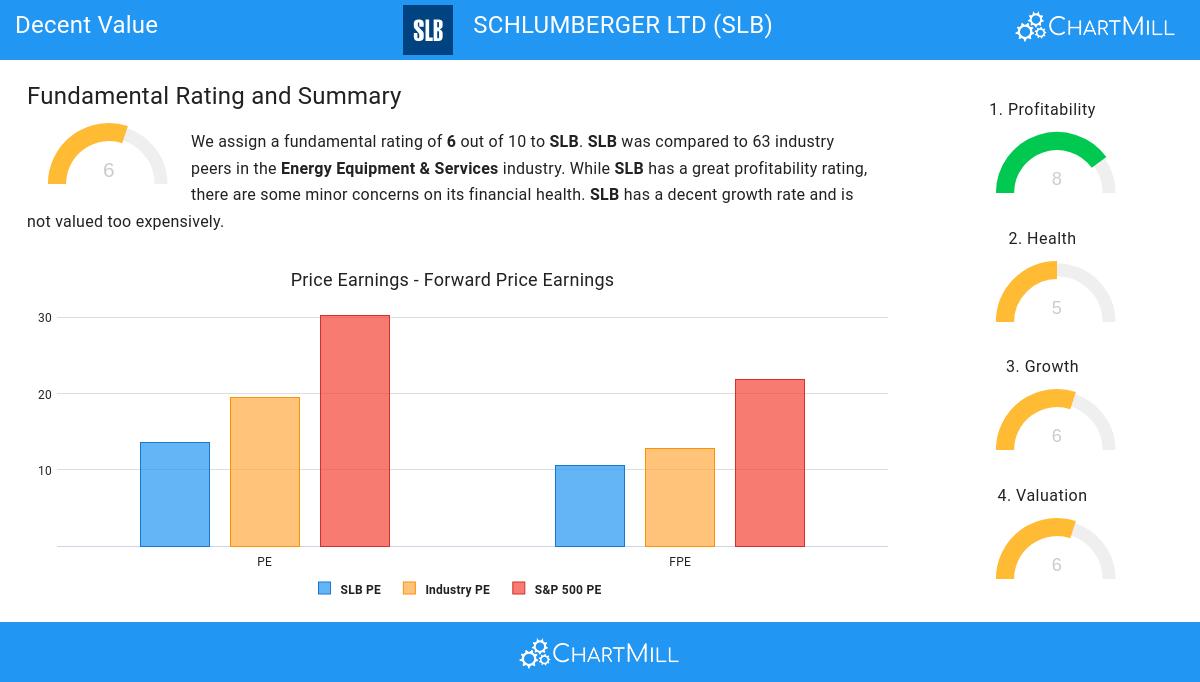
ChartMill assigns a proprietary Valuation Rating to each stock. The score is computed by evaluating various valuation aspects, like price to earnings and free cash flow, both absolutely as relative to the market and industry. NYSE:SLB was assigned a score of 6 for valuation:
- Based on the Price/Earnings ratio, SLB is valued a bit cheaper than 79.37% of the companies in the same industry.
- SLB is valuated cheaply when we compare the Price/Earnings ratio to 30.30, which is the current average of the S&P500 Index.
- A Price/Forward Earnings ratio of 10.58 indicates a reasonable valuation of SLB.
- SLB's Price/Forward Earnings ratio indicates a rather cheap valuation when compared to the S&P500 average which is at 21.86.
- Based on the Price/Free Cash Flow ratio, SLB is valued a bit cheaper than 60.32% of the companies in the same industry.
- SLB's low PEG Ratio(NY), which compensates the Price/Earnings for growth, indicates a rather cheap valuation of the company.
- The excellent profitability rating of SLB may justify a higher PE ratio.
- A more expensive valuation may be justified as SLB's earnings are expected to grow with 16.88% in the coming years.
Exploring NYSE:SLB's Profitability
ChartMill utilizes a Profitability Rating to assess stocks, scoring them on a scale of 0 to 10. This rating takes into account a variety of profitability ratios and margins, both in absolute terms and in comparison to industry peers. NYSE:SLB has earned a 8 out of 10:
- SLB's Return On Assets of 8.94% is amongst the best of the industry. SLB outperforms 80.95% of its industry peers.
- SLB's Return On Equity of 20.95% is amongst the best of the industry. SLB outperforms 88.89% of its industry peers.
- SLB's Return On Invested Capital of 13.20% is amongst the best of the industry. SLB outperforms 87.30% of its industry peers.
- SLB had an Average Return On Invested Capital over the past 3 years of 10.34%. This is above the industry average of 7.65%.
- The last Return On Invested Capital (13.20%) for SLB is above the 3 year average (10.34%), which is a sign of increasing profitability.
- SLB has a Profit Margin of 12.56%. This is amongst the best in the industry. SLB outperforms 82.54% of its industry peers.
- SLB's Profit Margin has improved in the last couple of years.
- Looking at the Operating Margin, with a value of 17.06%, SLB is in the better half of the industry, outperforming 79.37% of the companies in the same industry.
- SLB's Operating Margin has improved in the last couple of years.
- SLB's Gross Margin has improved in the last couple of years.
Understanding NYSE:SLB's Health Score
Every stock is evaluated by ChartMill, receiving a Health Rating on a scale of 0 to 10. This assessment considers different health aspects, including liquidity and solvency, both in absolute terms and relative to industry peers. NYSE:SLB has achieved a 5 out of 10:
- SLB has an Altman-Z score of 3.02. This indicates that SLB is financially healthy and has little risk of bankruptcy at the moment.
- SLB's Altman-Z score of 3.02 is fine compared to the rest of the industry. SLB outperforms 73.02% of its industry peers.
- SLB has a debt to FCF ratio of 2.90. This is a good value and a sign of high solvency as SLB would need 2.90 years to pay back of all of its debts.
- With a decent Debt to FCF ratio value of 2.90, SLB is doing good in the industry, outperforming 65.08% of the companies in the same industry.
Looking at the Growth
ChartMill assigns a Growth Rating to each stock, ranging from 0 to 10. This rating is determined by analyzing different growth elements, including EPS and revenue growth, spanning both historical and future figures. In the case of NYSE:SLB, the assigned 6 reflects its growth potential:
- The Earnings Per Share has grown by an impressive 20.45% over the past year.
- Measured over the past years, SLB shows a quite strong growth in Earnings Per Share. The EPS has been growing by 12.90% on average per year.
- SLB shows quite a strong growth in Revenue. In the last year, the Revenue has grown by 12.68%.
- SLB is expected to show quite a strong growth in Earnings Per Share. In the coming years, the EPS will grow by 12.23% yearly.
- When comparing the Revenue growth rate of the last years to the growth rate of the upcoming years, we see that the growth is accelerating.
Every day, new Decent Value stocks can be found on ChartMill in our Decent Value screener.
Our latest full fundamental report of SLB contains the most current fundamental analsysis.
Keep in mind
This is not investing advice! The article highlights some of the observations at the time of writing, but you should always make your own analysis and invest based on your own insights.