
NYSE:SKX is showing decent growth, but is still valued reasonably.
By Mill Chart
Last update: Feb 3, 2025
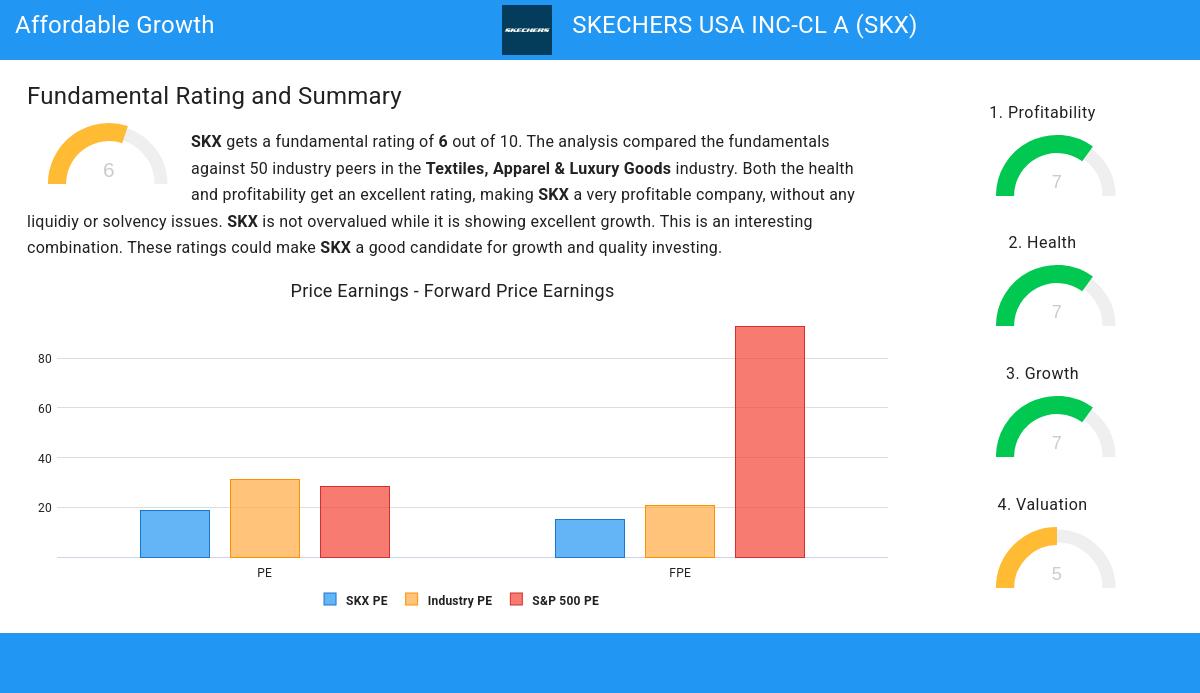
Here's SKECHERS USA INC-CL A (NYSE:SKX) for you, a growth stock our stock screener believes is undervalued. NYSE:SKX is scoring impressively in terms of growth while demonstrating strong financials. On top of that, it remains attractively priced. Let's break it down further.
Deciphering NYSE:SKX's Growth Rating
Every stock receives a Growth Rating from ChartMill, ranging from 0 to 10. This rating assesses various growth aspects, including historical and projected EPS and revenue growth. NYSE:SKX boasts a 7 out of 10:
- The Earnings Per Share has grown by an nice 19.06% over the past year.
- The Earnings Per Share has been growing by 11.78% on average over the past years. This is quite good.
- The Revenue has grown by 10.10% in the past year. This is quite good.
- The Revenue has been growing by 11.50% on average over the past years. This is quite good.
- The Earnings Per Share is expected to grow by 16.26% on average over the next years. This is quite good.
- The Revenue is expected to grow by 9.44% on average over the next years. This is quite good.
- When comparing the EPS growth rate of the last years to the growth rate of the upcoming years, we see that the growth is accelerating.
Deciphering NYSE:SKX's Valuation Rating
To assess a stock's valuation, ChartMill utilizes a Valuation Rating on a scale of 0 to 10. This comprehensive assessment considers various valuation aspects, comparing price to earnings and cash flows, while factoring in profitability and growth. NYSE:SKX has achieved a 5 out of 10:
- Compared to the rest of the industry, the Price/Earnings ratio of SKX indicates a somewhat cheap valuation: SKX is cheaper than 61.22% of the companies listed in the same industry.
- SKX is valuated rather cheaply when we compare the Price/Earnings ratio to 28.46, which is the current average of the S&P500 Index.
- Compared to the rest of the industry, the Price/Forward Earnings ratio of SKX indicates a somewhat cheap valuation: SKX is cheaper than 65.31% of the companies listed in the same industry.
- SKX is valuated cheaply when we compare the Price/Forward Earnings ratio to 92.87, which is the current average of the S&P500 Index.
- Based on the Enterprise Value to EBITDA ratio, SKX is valued a bit cheaper than the industry average as 75.51% of the companies are valued more expensively.
- The low PEG Ratio(NY), which compensates the Price/Earnings for growth, indicates a rather cheap valuation of the company.
- The decent profitability rating of SKX may justify a higher PE ratio.
- A more expensive valuation may be justified as SKX's earnings are expected to grow with 18.65% in the coming years.
Health Assessment of NYSE:SKX
ChartMill employs its own Health Rating for stock assessment. This rating, ranging from 0 to 10, is calculated by examining various liquidity and solvency ratios. In the case of NYSE:SKX, the assigned 7 reflects its health status:
- An Altman-Z score of 3.95 indicates that SKX is not in any danger for bankruptcy at the moment.
- SKX has a better Altman-Z score (3.95) than 75.51% of its industry peers.
- SKX has a debt to FCF ratio of 1.58. This is a very positive value and a sign of high solvency as it would only need 1.58 years to pay back of all of its debts.
- SKX has a better Debt to FCF ratio (1.58) than 73.47% of its industry peers.
- A Debt/Equity ratio of 0.06 indicates that SKX is not too dependend on debt financing.
- With a decent Debt to Equity ratio value of 0.06, SKX is doing good in the industry, outperforming 73.47% of the companies in the same industry.
Evaluating Profitability: NYSE:SKX
ChartMill's Profitability Rating offers a unique perspective on stock analysis, providing scores from 0 to 10. These ratings consider a wide range of profitability metrics and margins, both in comparison to industry peers and on their own merits. For NYSE:SKX, the assigned 7 is a significant indicator of profitability:
- SKX has a Return On Assets of 7.26%. This is in the better half of the industry: SKX outperforms 77.55% of its industry peers.
- With a decent Return On Equity value of 14.39%, SKX is doing good in the industry, outperforming 75.51% of the companies in the same industry.
- SKX has a Return On Invested Capital of 10.99%. This is in the better half of the industry: SKX outperforms 75.51% of its industry peers.
- The last Return On Invested Capital (10.99%) for SKX is above the 3 year average (9.66%), which is a sign of increasing profitability.
- SKX's Profit Margin of 7.20% is fine compared to the rest of the industry. SKX outperforms 75.51% of its industry peers.
- Looking at the Operating Margin, with a value of 9.97%, SKX is in the better half of the industry, outperforming 73.47% of the companies in the same industry.
- The Gross Margin of SKX (53.12%) is better than 63.27% of its industry peers.
- In the last couple of years the Gross Margin of SKX has grown nicely.
Our Affordable Growth screener lists more Affordable Growth stocks and is updated daily.
Check the latest full fundamental report of SKX for a complete fundamental analysis.
Disclaimer
This article should in no way be interpreted as advice. The article is based on the observed metrics at the time of writing, but you should always make your own analysis and trade or invest at your own responsibility.
