
Consider SKECHERS USA INC-CL A (NYSE:SKX) as an affordable growth stock, identified by our stock screening tool. NYSE:SKX is showcasing impressive growth figures and is well-positioned in terms of profitability, solvency, and liquidity. Moreover, it seems to be priced reasonably. Let's dive deeper into the analysis.
Assessing Growth for NYSE:SKX
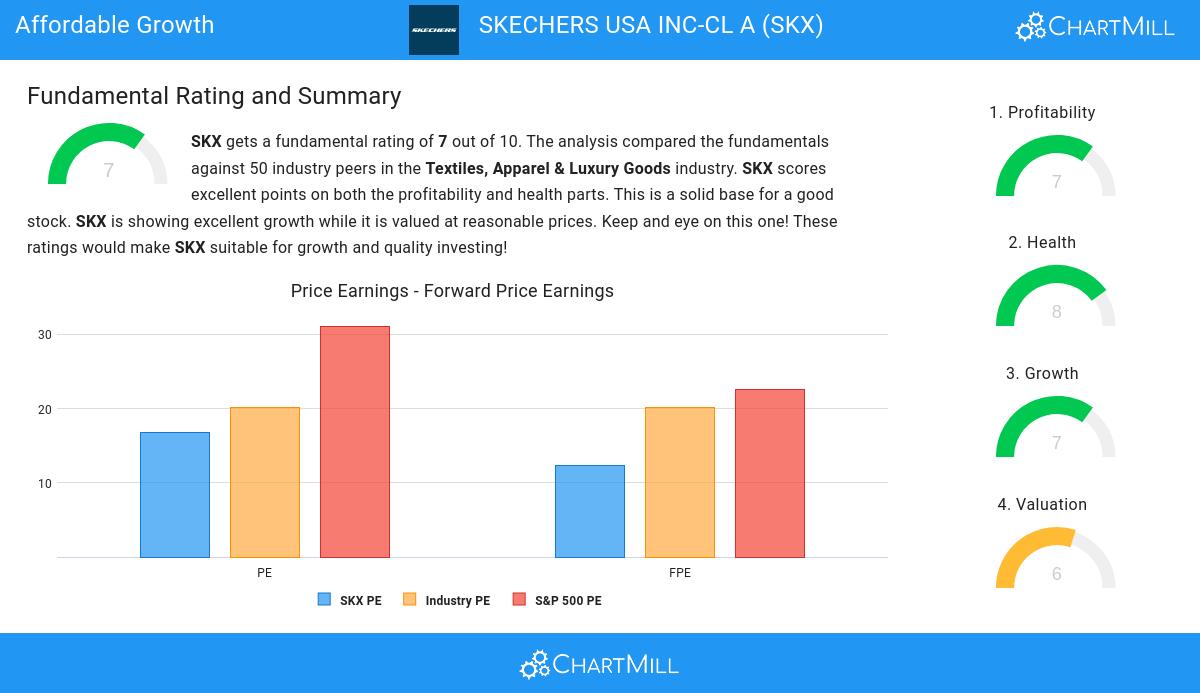
ChartMill assigns a proprietary Growth Rating to each stock. The score is computed by evaluating various growth aspects, like EPS and revenue growth. We take into account the history as well as the estimated future numbers. NYSE:SKX was assigned a score of 7 for growth:
- The Earnings Per Share has grown by an impressive 23.10% over the past year.
- The Earnings Per Share has been growing by 11.78% on average over the past years. This is quite good.
- SKX shows quite a strong growth in Revenue. In the last year, the Revenue has grown by 8.02%.
- Measured over the past years, SKX shows a quite strong growth in Revenue. The Revenue has been growing by 11.50% on average per year.
- The Earnings Per Share is expected to grow by 16.14% on average over the next years. This is quite good.
- SKX is expected to show quite a strong growth in Revenue. In the coming years, the Revenue will grow by 8.70% yearly.
- When comparing the EPS growth rate of the last years to the growth rate of the upcoming years, we see that the growth is accelerating.
Deciphering NYSE:SKX's Valuation Rating
An integral part of ChartMill's stock analysis is the Valuation Rating, which spans from 0 to 10. This rating evaluates diverse valuation factors, including price to earnings and cash flows, while considering the stock's profitability and growth. NYSE:SKX has received a 6 out of 10:
- SKX's Price/Earnings ratio is a bit cheaper when compared to the industry. SKX is cheaper than 66.00% of the companies in the same industry.
- SKX is valuated rather cheaply when we compare the Price/Earnings ratio to 31.10, which is the current average of the S&P500 Index.
- Based on the Price/Forward Earnings ratio, SKX is valued a bit cheaper than the industry average as 74.00% of the companies are valued more expensively.
- SKX is valuated rather cheaply when we compare the Price/Forward Earnings ratio to 22.54, which is the current average of the S&P500 Index.
- SKX's Enterprise Value to EBITDA ratio is a bit cheaper when compared to the industry. SKX is cheaper than 76.00% of the companies in the same industry.
- SKX's low PEG Ratio(NY), which compensates the Price/Earnings for growth, indicates a rather cheap valuation of the company.
- The decent profitability rating of SKX may justify a higher PE ratio.
- SKX's earnings are expected to grow with 21.36% in the coming years. This may justify a more expensive valuation.
How do we evaluate the Health for NYSE:SKX?
ChartMill employs its own Health Rating for stock assessment. This rating, ranging from 0 to 10, is calculated by examining various liquidity and solvency ratios. In the case of NYSE:SKX, the assigned 8 reflects its health status:
- SKX has an Altman-Z score of 3.98. This indicates that SKX is financially healthy and has little risk of bankruptcy at the moment.
- SKX's Altman-Z score of 3.98 is fine compared to the rest of the industry. SKX outperforms 74.00% of its industry peers.
- The Debt to FCF ratio of SKX is 0.42, which is an excellent value as it means it would take SKX, only 0.42 years of fcf income to pay off all of its debts.
- SKX has a Debt to FCF ratio of 0.42. This is amongst the best in the industry. SKX outperforms 82.00% of its industry peers.
- A Debt/Equity ratio of 0.01 indicates that SKX is not too dependend on debt financing.
- With a decent Debt to Equity ratio value of 0.01, SKX is doing good in the industry, outperforming 78.00% of the companies in the same industry.
- A Current Ratio of 2.06 indicates that SKX has no problem at all paying its short term obligations.
Profitability Assessment of NYSE:SKX
Discover ChartMill's exclusive Profitability Rating, a proprietary metric that assesses stocks on a scale of 0 to 10. It takes into consideration various profitability ratios and margins, both in absolute terms and relative to industry peers. Notably, NYSE:SKX has achieved a 7:
- SKX's Return On Assets of 7.27% is fine compared to the rest of the industry. SKX outperforms 76.00% of its industry peers.
- SKX has a better Return On Equity (13.73%) than 74.00% of its industry peers.
- With a decent Return On Invested Capital value of 11.72%, SKX is doing good in the industry, outperforming 74.00% of the companies in the same industry.
- The 3 year average ROIC (9.66%) for SKX is below the current ROIC(11.72%), indicating increased profibility in the last year.
- The Profit Margin of SKX (6.90%) is better than 74.00% of its industry peers.
- Looking at the Operating Margin, with a value of 10.11%, SKX is in the better half of the industry, outperforming 74.00% of the companies in the same industry.
- SKX's Gross Margin of 53.36% is fine compared to the rest of the industry. SKX outperforms 64.00% of its industry peers.
- In the last couple of years the Gross Margin of SKX has grown nicely.
More Affordable Growth stocks can be found in our Affordable Growth screener.
Our latest full fundamental report of SKX contains the most current fundamental analsysis.
Disclaimer
This article should in no way be interpreted as advice. The article is based on the observed metrics at the time of writing, but you should always make your own analysis and trade or invest at your own responsibility.