
Our stock screening tool has pinpointed SKECHERS USA INC-CL A (NYSE:SKX) as a growth stock that isn't overvalued. NYSE:SKX is excelling in various growth indicators while maintaining a solid financial footing. Furthermore, it remains attractively priced. Let's delve into the specifics below.
Growth Assessment of NYSE:SKX
ChartMill assigns a Growth Rating to every stock. This score ranges from 0 to 10 and evaluates the different growth aspects like EPS and Revenue, both in the past as in the future. NYSE:SKX scores a 7 out of 10:
- SKX shows a strong growth in Earnings Per Share. In the last year, the EPS has been growing by 23.10%, which is quite impressive.
- The Earnings Per Share has been growing by 11.78% on average over the past years. This is quite good.
- The Revenue has grown by 8.02% in the past year. This is quite good.
- Measured over the past years, SKX shows a quite strong growth in Revenue. The Revenue has been growing by 11.50% on average per year.
- The Earnings Per Share is expected to grow by 16.14% on average over the next years. This is quite good.
- Based on estimates for the next years, SKX will show a quite strong growth in Revenue. The Revenue will grow by 8.70% on average per year.
- When comparing the EPS growth rate of the last years to the growth rate of the upcoming years, we see that the growth is accelerating.
Valuation Analysis for NYSE:SKX
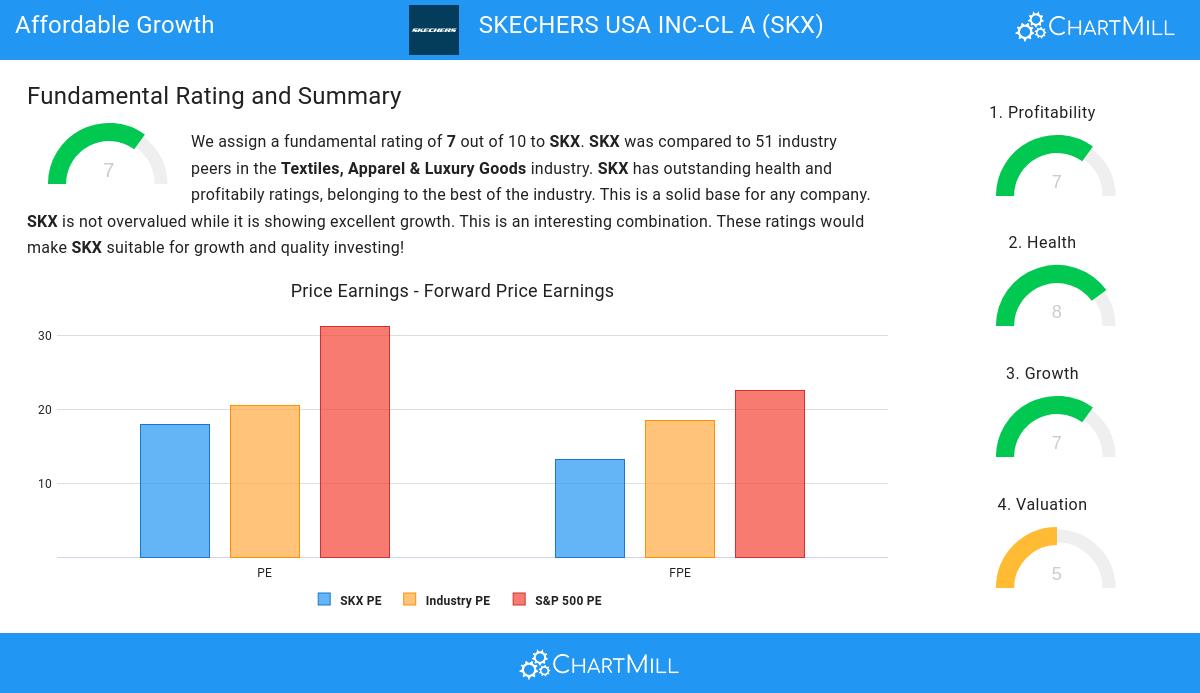
ChartMill assigns a Valuation Rating to every stock. This score ranges from 0 to 10 and evaluates the different valuation aspects and compares the price to earnings and cash flows, while taking into account profitability and growth. NYSE:SKX scores a 5 out of 10:
- Based on the Price/Earnings ratio, SKX is valued a bit cheaper than the industry average as 70.00% of the companies are valued more expensively.
- Compared to an average S&P500 Price/Earnings ratio of 31.26, SKX is valued a bit cheaper.
- Based on the Price/Forward Earnings ratio, SKX is valued a bit cheaper than 72.00% of the companies in the same industry.
- When comparing the Price/Forward Earnings ratio of SKX to the average of the S&P500 Index (22.55), we can say SKX is valued slightly cheaper.
- 76.00% of the companies in the same industry are more expensive than SKX, based on the Enterprise Value to EBITDA ratio.
- SKX's low PEG Ratio(NY), which compensates the Price/Earnings for growth, indicates a rather cheap valuation of the company.
- SKX has a very decent profitability rating, which may justify a higher PE ratio.
- SKX's earnings are expected to grow with 21.36% in the coming years. This may justify a more expensive valuation.
What does the Health looks like for NYSE:SKX
Every stock is evaluated by ChartMill, receiving a Health Rating on a scale of 0 to 10. This assessment considers different health aspects, including liquidity and solvency, both in absolute terms and relative to industry peers. NYSE:SKX has achieved a 8 out of 10:
- SKX has an Altman-Z score of 4.09. This indicates that SKX is financially healthy and has little risk of bankruptcy at the moment.
- The Altman-Z score of SKX (4.09) is better than 74.00% of its industry peers.
- The Debt to FCF ratio of SKX is 0.42, which is an excellent value as it means it would take SKX, only 0.42 years of fcf income to pay off all of its debts.
- With an excellent Debt to FCF ratio value of 0.42, SKX belongs to the best of the industry, outperforming 82.00% of the companies in the same industry.
- SKX has a Debt/Equity ratio of 0.01. This is a healthy value indicating a solid balance between debt and equity.
- Looking at the Debt to Equity ratio, with a value of 0.01, SKX is in the better half of the industry, outperforming 78.00% of the companies in the same industry.
- SKX has a Current Ratio of 2.06. This indicates that SKX is financially healthy and has no problem in meeting its short term obligations.
Assessing Profitability for NYSE:SKX
Discover ChartMill's exclusive Profitability Rating, a proprietary metric that assesses stocks on a scale of 0 to 10. It takes into consideration various profitability ratios and margins, both in absolute terms and relative to industry peers. Notably, NYSE:SKX has achieved a 7:
- Looking at the Return On Assets, with a value of 7.27%, SKX is in the better half of the industry, outperforming 76.00% of the companies in the same industry.
- With a decent Return On Equity value of 13.73%, SKX is doing good in the industry, outperforming 74.00% of the companies in the same industry.
- SKX has a better Return On Invested Capital (11.72%) than 74.00% of its industry peers.
- The 3 year average ROIC (9.66%) for SKX is below the current ROIC(11.72%), indicating increased profibility in the last year.
- SKX has a Profit Margin of 6.90%. This is in the better half of the industry: SKX outperforms 74.00% of its industry peers.
- SKX has a Operating Margin of 10.11%. This is in the better half of the industry: SKX outperforms 74.00% of its industry peers.
- With a decent Gross Margin value of 53.36%, SKX is doing good in the industry, outperforming 64.00% of the companies in the same industry.
- In the last couple of years the Gross Margin of SKX has grown nicely.
Every day, new Affordable Growth stocks can be found on ChartMill in our Affordable Growth screener.
Check the latest full fundamental report of SKX for a complete fundamental analysis.
Keep in mind
This article should in no way be interpreted as advice. The article is based on the observed metrics at the time of writing, but you should always make your own analysis and trade or invest at your own responsibility.