
NYSE:SKX is showing good growth, while it is not too expensive.
By Mill Chart
Last update: Sep 5, 2024
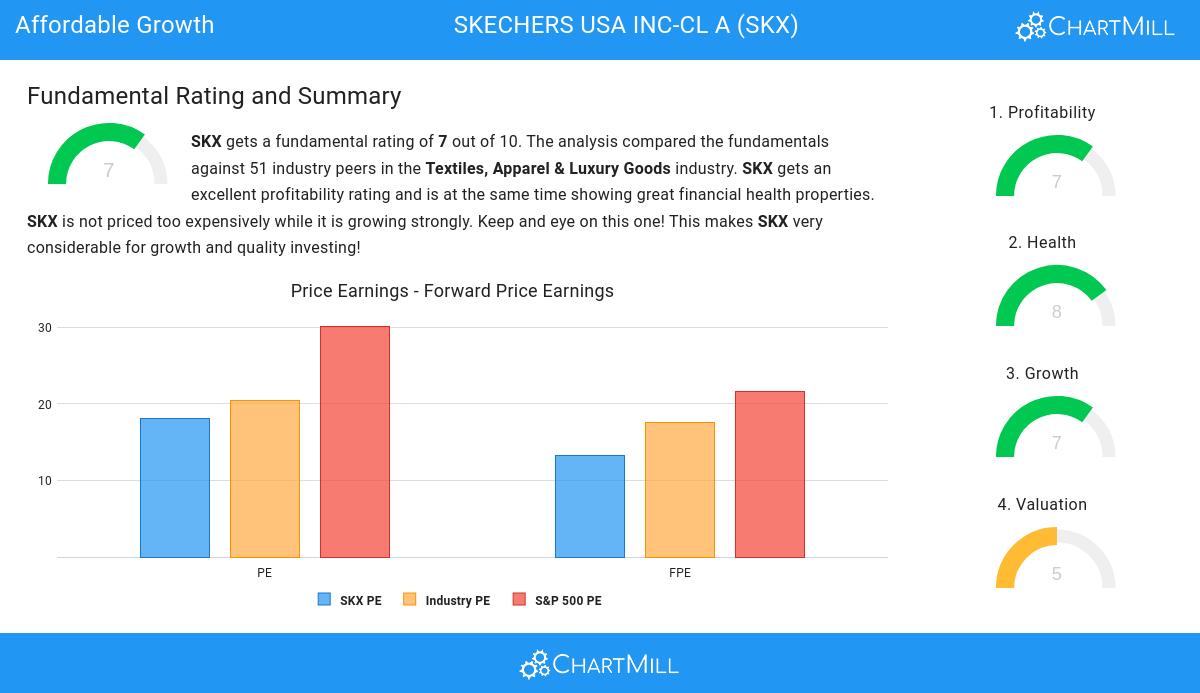
Our stock screener has spotted SKECHERS USA INC-CL A (NYSE:SKX) as a growth stock which is not overvalued. NYSE:SKX is scoring great on several growth aspects while it also shows decent health and profitability. At the same time it remains remains attractively priced. We'll dive into each aspect below.
Understanding NYSE:SKX's Growth
Every stock receives a Growth Rating from ChartMill, ranging from 0 to 10. This rating assesses various growth aspects, including historical and projected EPS and revenue growth. NYSE:SKX boasts a 7 out of 10:
- The Earnings Per Share has grown by an impressive 23.10% over the past year.
- SKX shows quite a strong growth in Earnings Per Share. Measured over the last years, the EPS has been growing by 11.78% yearly.
- The Revenue has grown by 8.02% in the past year. This is quite good.
- The Revenue has been growing by 11.50% on average over the past years. This is quite good.
- Based on estimates for the next years, SKX will show a quite strong growth in Earnings Per Share. The EPS will grow by 16.14% on average per year.
- SKX is expected to show quite a strong growth in Revenue. In the coming years, the Revenue will grow by 8.70% yearly.
- When comparing the EPS growth rate of the last years to the growth rate of the upcoming years, we see that the growth is accelerating.
Unpacking NYSE:SKX's Valuation Rating
ChartMill assigns a Valuation Rating to every stock. This score ranges from 0 to 10 and evaluates the different valuation aspects and compares the price to earnings and cash flows, while taking into account profitability and growth. NYSE:SKX scores a 5 out of 10:
- SKX's Price/Earnings ratio indicates a valuation a bit cheaper than the S&P500 average which is at 30.17.
- Based on the Price/Forward Earnings ratio, SKX is valued a bit cheaper than the industry average as 62.00% of the companies are valued more expensively.
- Compared to an average S&P500 Price/Forward Earnings ratio of 21.56, SKX is valued a bit cheaper.
- SKX's Enterprise Value to EBITDA ratio is a bit cheaper when compared to the industry. SKX is cheaper than 72.00% of the companies in the same industry.
- The low PEG Ratio(NY), which compensates the Price/Earnings for growth, indicates a rather cheap valuation of the company.
- The decent profitability rating of SKX may justify a higher PE ratio.
- SKX's earnings are expected to grow with 21.36% in the coming years. This may justify a more expensive valuation.
Health Assessment of NYSE:SKX
A critical element of ChartMill's stock evaluation is the Health Rating, which spans from 0 to 10. This rating considers multiple health factors, including liquidity and solvency, both in absolute terms and relative to industry peers. NYSE:SKX has received a 8 out of 10:
- An Altman-Z score of 4.10 indicates that SKX is not in any danger for bankruptcy at the moment.
- SKX has a better Altman-Z score (4.10) than 70.00% of its industry peers.
- The Debt to FCF ratio of SKX is 0.42, which is an excellent value as it means it would take SKX, only 0.42 years of fcf income to pay off all of its debts.
- With an excellent Debt to FCF ratio value of 0.42, SKX belongs to the best of the industry, outperforming 82.00% of the companies in the same industry.
- A Debt/Equity ratio of 0.01 indicates that SKX is not too dependend on debt financing.
- SKX has a Debt to Equity ratio of 0.01. This is in the better half of the industry: SKX outperforms 78.00% of its industry peers.
- SKX has a Current Ratio of 2.06. This indicates that SKX is financially healthy and has no problem in meeting its short term obligations.
Profitability Examination for NYSE:SKX
ChartMill assigns a Profitability Rating to every stock. This score ranges from 0 to 10 and evaluates the different profitability ratios and margins, both absolutely, but also relative to the industry peers. NYSE:SKX scores a 7 out of 10:
- With a decent Return On Assets value of 7.27%, SKX is doing good in the industry, outperforming 74.00% of the companies in the same industry.
- SKX has a better Return On Equity (13.73%) than 72.00% of its industry peers.
- The Return On Invested Capital of SKX (11.72%) is better than 74.00% of its industry peers.
- The 3 year average ROIC (9.66%) for SKX is below the current ROIC(11.72%), indicating increased profibility in the last year.
- With a decent Profit Margin value of 6.90%, SKX is doing good in the industry, outperforming 72.00% of the companies in the same industry.
- SKX has a better Operating Margin (10.11%) than 70.00% of its industry peers.
- SKX's Gross Margin of 53.36% is fine compared to the rest of the industry. SKX outperforms 64.00% of its industry peers.
- SKX's Gross Margin has improved in the last couple of years.
Every day, new Affordable Growth stocks can be found on ChartMill in our Affordable Growth screener.
Check the latest full fundamental report of SKX for a complete fundamental analysis.
Disclaimer
Important Note: The content of this article is not intended as trading advice. It is essential to perform your own analysis and exercise caution when making trading decisions. The article presents observations created by automated analysis but does not guarantee any trading or investment outcomes. Always trade responsibly and make independent judgments.