
Evaluating SEA LTD-ADR (NYSE:SE) for high Growth Investment Opportunities.
By Mill Chart
Last update: Apr 2, 2025
SEA LTD-ADR (NYSE:SE) has been identified as a Technical Breakout Setup Pattern by our stock screener. This pattern typically occurs when a stock takes a pause after a significant rise, indicating the possibility of a continuation in the trend. While it's impossible to predict with certainty, it might be beneficial to monitor NYSE:SE.
In-Depth Technical Analysis of SE
ChartMill employs a sophisticated system to assign a Technical Rating to every stock in its analysis. This rating, which ranges from 0 to 10, is determined by carefully assessing multiple technical indicators and properties.
We assign a technical rating of 10 out of 10 to SE. This is due to a consistent performance in both the short and longer term time frames. Also compared to the overall market, SE is showing a nice and steady performance.
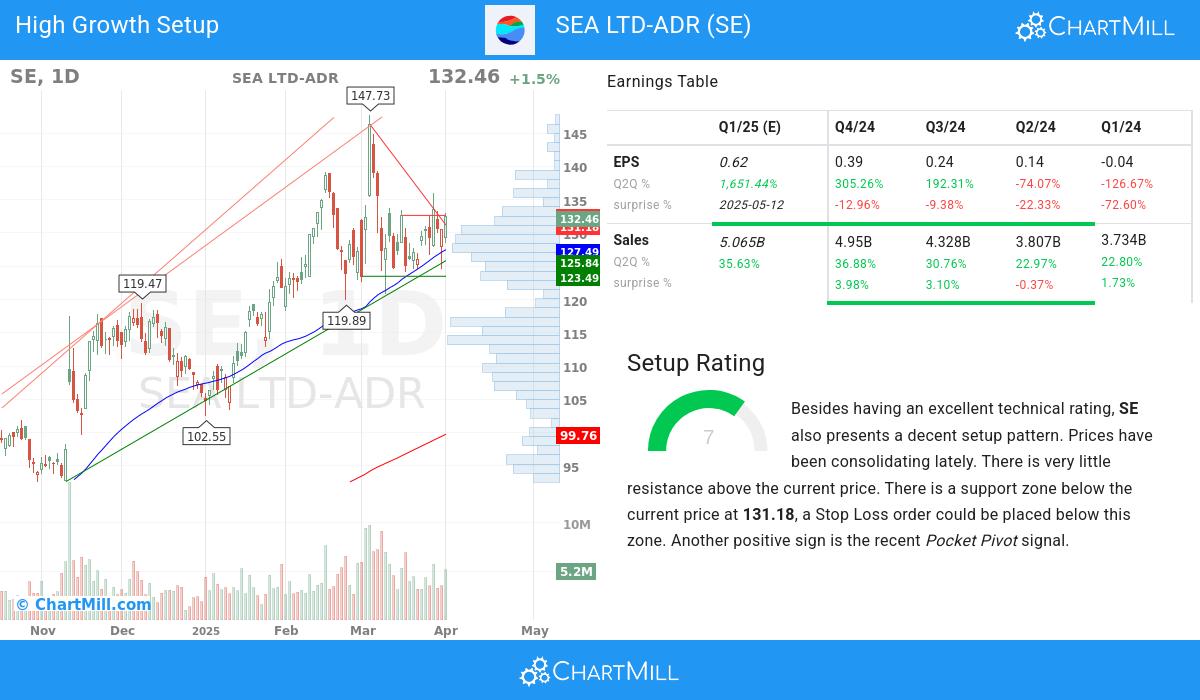
- The long term trend is positive and the short term trend is neutral. The long term trend gets the benefit of the doubt for now.
- Looking at the yearly performance, SE did better than 98% of all other stocks. We also observe that the gains produced by SE over the past year are nicely spread over this period.
- SE is one of the better performing stocks in the Entertainment industry, it outperforms 98% of 73 stocks in the same industry.
- SE is currently trading in the upper part of its 52 week range. The market is still in the middle of its 52 week range, so SE slightly outperforms the market at the moment.
- In the last month SE has a been trading in the 120.81 - 147.73 range, which is quite wide. It is currently trading in the middle of this range, so some resistance may be found above.
For an up to date full technical analysis you can check the technical report of SE
Looking at the Setup
Next to the Technical Rating, the Setup Rating of a stock determines to which extend the stock is consolidating. This score also ranges from 0 to 10 and is updated daily. The setup score evaluates various short term technical indicators. For SE this score is currently 7:
Besides having an excellent technical rating, SE also presents a decent setup pattern. Prices have been consolidating lately. There is very little resistance above the current price. There is a support zone below the current price at 131.18, a Stop Loss order could be placed below this zone. Another positive sign is the recent Pocket Pivot signal.
Some of the high growth metrics of SE highlighted
ChartMill assigns a High Growth Momentum Rating (HGM) to every stock. This score ranges from 0 to 10 and evaluates the different growth and profitability aspects, including accelleration, surprises and revisions. SE scores a 6 out of 10:
Explosive Earnings Growth
- The EPS of SE has exhibited growth from one quarter to another (Q2Q), with a 305.0% increase. This underscores the company's ability to generate higher earnings and improve its financial standing.
- Accelerating EPS growth for SE: the current Q2Q growth of 305.0% exceeds the previous quarter Q2Q growth of 192.0%.
- Sales acceleration happened 3 quarters in a row.
- Over the past year, SE has demonstrated 204.0% growth in EPS, signifying its positive financial trajectory and potential for future profitability.
- SE has achieved significant quarter-to-quarter (Q2Q) revenue growth of 36.88%, signaling its ability to capture market opportunities and drive top-line expansion. This growth underscores the company's effective execution and its potential for continued success.
- SE shows accelerating Sales growth: when comparing the current Q2Q growth of 36.88% to the previous quarter Q2Q growth of 30.75%, we see the growth rate improving.
- Sales growth accelerated for 3 quarters in a row.
- With notable 1-year revenue growth of 28.75%, SE exemplifies its ability to generate increased sales and revenue streams. This growth signifies the company's strong business performance and its potential for future growth.
Profitability & Financial Strength
- The operating margin of SE has seen steady growth over the past year, signaling improved profitability. This trend indicates the company's effective cost management and its ability to generate higher returns.
- The profit margin of SE has seen steady growth over the past year, signaling improved profitability.
- SE's Debt/Equity ratio of 0.68 suggests a healthy balance between debt financing and shareholder equity.
Market Strength & Institutional Confidence
- With 66.92% of the total shares held by institutional investors, SE showcases a healthy distribution of ownership. This suggests a mix of institutional and retail investors, fostering a dynamic market for the stock.
- SE has exhibited strong Relative Strength(RS) in recent periods, with a current 98.31 rating. This indicates the stock's ability to outperform the broader market and reflects its competitive position.
More ideas for high growth momentum breakouts can be found on ChartMill in our High Growth Momentum Breakout screen.
Disclaimer
Important Note: The content of this article is not intended as trading advice. It is essential to perform your own analysis and exercise caution when making trading decisions. The article presents observations created by automated analysis but does not guarantee any trading or investment outcomes. Always trade responsibly and make independent judgments.
