
Our stock screening tool has pinpointed SEADRILL LIMITED (NYSE:SDRL) as an undervalued stock. NYSE:SDRL maintains a solid financial footing. Furthermore, it remains attractively priced. Let's delve into the specifics below.
Valuation Analysis for NYSE:SDRL
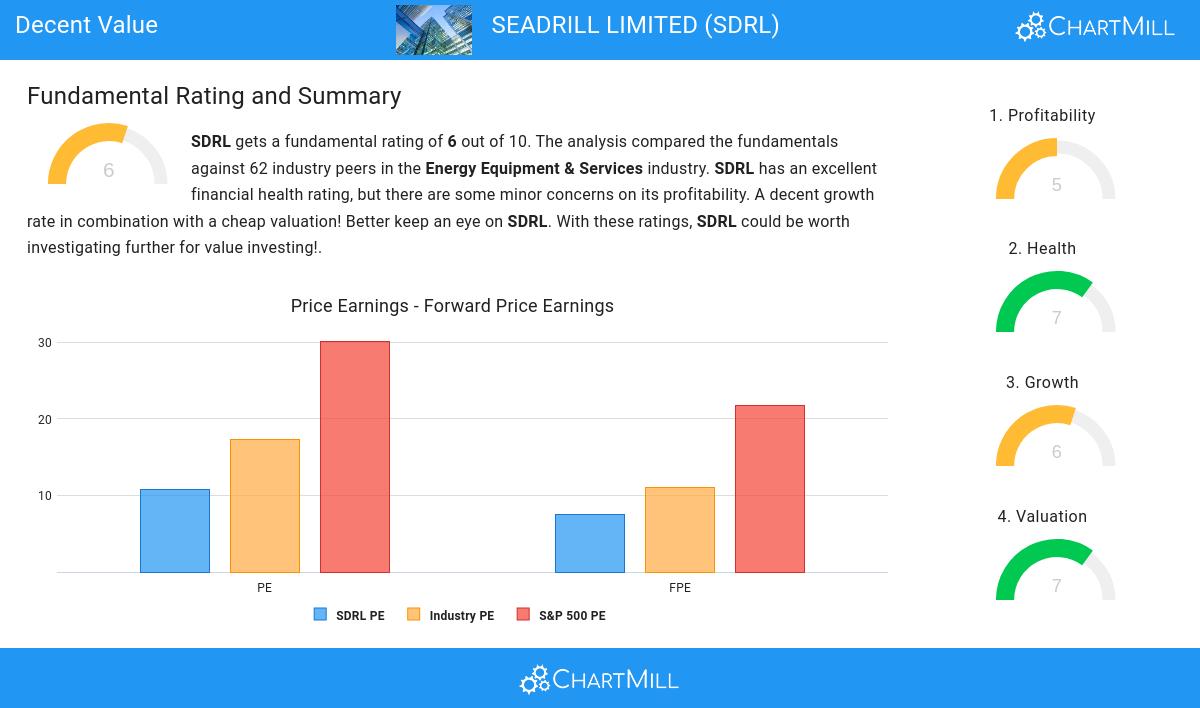
ChartMill assigns a Valuation Rating to each stock, ranging from 0 to 10. This rating is calculated by analyzing different valuation elements, such as price to earnings and free cash flow, both in absolute terms and relative to the market and industry. In the case of NYSE:SDRL, the assigned 7 reflects its valuation:
- A Price/Earnings ratio of 10.78 indicates a reasonable valuation of SDRL.
- Based on the Price/Earnings ratio, SDRL is valued cheaper than 83.87% of the companies in the same industry.
- The average S&P500 Price/Earnings ratio is at 30.15. SDRL is valued rather cheaply when compared to this.
- The Price/Forward Earnings ratio is 7.46, which indicates a rather cheap valuation of SDRL.
- Based on the Price/Forward Earnings ratio, SDRL is valued a bit cheaper than the industry average as 79.03% of the companies are valued more expensively.
- SDRL is valuated cheaply when we compare the Price/Forward Earnings ratio to 21.77, which is the current average of the S&P500 Index.
- Based on the Enterprise Value to EBITDA ratio, SDRL is valued a bit cheaper than 72.58% of the companies in the same industry.
- Based on the Price/Free Cash Flow ratio, SDRL is valued a bit cheaper than the industry average as 64.52% of the companies are valued more expensively.
- A more expensive valuation may be justified as SDRL's earnings are expected to grow with 30.05% in the coming years.
Profitability Examination for NYSE:SDRL
ChartMill's Profitability Rating offers a unique perspective on stock analysis, providing scores from 0 to 10. These ratings consider a wide range of profitability metrics and margins, both in comparison to industry peers and on their own merits. For NYSE:SDRL, the assigned 5 is a significant indicator of profitability:
- SDRL has a better Return On Assets (11.08%) than 90.32% of its industry peers.
- The Return On Equity of SDRL (15.56%) is better than 75.81% of its industry peers.
- Looking at the Profit Margin, with a value of 30.43%, SDRL belongs to the top of the industry, outperforming 98.39% of the companies in the same industry.
- Looking at the Operating Margin, with a value of 21.55%, SDRL belongs to the top of the industry, outperforming 85.48% of the companies in the same industry.
- With a decent Gross Margin value of 37.02%, SDRL is doing good in the industry, outperforming 70.97% of the companies in the same industry.
- In the last couple of years the Gross Margin of SDRL has grown nicely.
How We Gauge Health for NYSE:SDRL
To gauge a stock's financial health, ChartMill utilizes a Health Rating on a scale of 0 to 10. This comprehensive evaluation encompasses liquidity and solvency, both in absolute terms and in comparison to industry peers. NYSE:SDRL has earned a 7 out of 10:
- SDRL has a better Altman-Z score (2.38) than 66.13% of its industry peers.
- The Debt to FCF ratio of SDRL is 2.79, which is a good value as it means it would take SDRL, 2.79 years of fcf income to pay off all of its debts.
- With a decent Debt to FCF ratio value of 2.79, SDRL is doing good in the industry, outperforming 67.74% of the companies in the same industry.
- A Debt/Equity ratio of 0.20 indicates that SDRL is not too dependend on debt financing.
- The Debt to Equity ratio of SDRL (0.20) is better than 61.29% of its industry peers.
- A Current Ratio of 3.19 indicates that SDRL has no problem at all paying its short term obligations.
- Looking at the Current ratio, with a value of 3.19, SDRL belongs to the top of the industry, outperforming 83.87% of the companies in the same industry.
- A Quick Ratio of 3.19 indicates that SDRL has no problem at all paying its short term obligations.
- Looking at the Quick ratio, with a value of 3.19, SDRL belongs to the top of the industry, outperforming 90.32% of the companies in the same industry.
Growth Assessment of NYSE:SDRL
ChartMill assigns a Growth Rating to every stock. This score ranges from 0 to 10 and evaluates the different growth aspects like EPS and Revenue, both in the past as in the future. NYSE:SDRL scores a 6 out of 10:
- SDRL shows a strong growth in Earnings Per Share. In the last year, the EPS has been growing by 194.87%, which is quite impressive.
- SDRL shows a strong growth in Revenue. In the last year, the Revenue has grown by 48.42%.
- Measured over the past years, SDRL shows a quite strong growth in Revenue. The Revenue has been growing by 12.35% on average per year.
- Based on estimates for the next years, SDRL will show a very strong growth in Earnings Per Share. The EPS will grow by 30.05% on average per year.
- Based on estimates for the next years, SDRL will show a quite strong growth in Revenue. The Revenue will grow by 10.27% on average per year.
Our Decent Value screener lists more Decent Value stocks and is updated daily.
Our latest full fundamental report of SDRL contains the most current fundamental analsysis.
Disclaimer
This article should in no way be interpreted as advice. The article is based on the observed metrics at the time of writing, but you should always make your own analysis and trade or invest at your own responsibility.

