
Exploring SCHWAB (CHARLES) CORP's Technical Signals and Breakout Potential.
By Mill Chart
Last update: Nov 28, 2024
A possible breakout setup was detected on SCHWAB (CHARLES) CORP (NYSE:SCHW) by our stockscreener. A breakout pattern is formed when a stock consolidates after a strong rise up. We note that this pattern is detected purely based on technical analysis and whether the breakout actually materializes remains to be seen. It could be interesting to keep an eye on NYSE:SCHW.
Analyzing the Technical Aspects
Every day ChartMill assigns a Technical Rating to every stock. The score ranges from 0 to 10 and is determined by evaluating multiple technical indicators and properties.
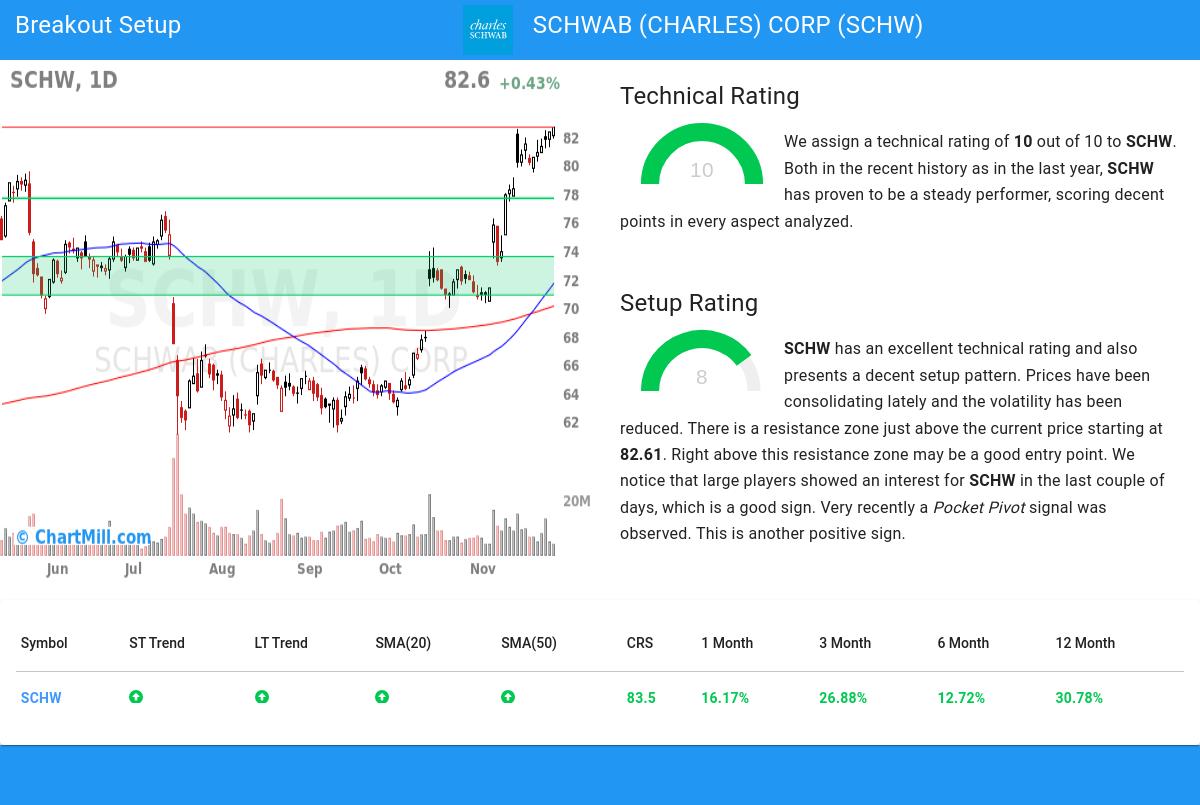
Overall SCHW gets a technical rating of 10 out of 10. This is due to a consistent performance in both the short and longer term time frames. Also compared to the overall market, SCHW is showing a nice and steady performance.
- The long and short term trends are both positive. This is looking good!
- When comparing the yearly performance of all stocks, we notice that SCHW is one of the better performing stocks in the market, outperforming 83% of all stocks.
- SCHW is one of the better performing stocks in the Capital Markets industry, it outperforms 76% of 220 stocks in the same industry.
- SCHW is currently making a new 52 week high. This is a strong signal. The S&P500 Index however is also trading near new highs, which makes the performance in line with the market.
- In the last month SCHW has a been trading in the 70.29 - 82.66 range, which is quite wide. It is currently trading near the high of this range.
Check the latest full technical report of SCHW for a complete technical analysis.
Looking at the Setup
Next to the Technical Rating, the Setup Rating of a stock determines to which extend the stock is consolidating. This score also ranges from 0 to 10 and is updated daily. The setup score evaluates various short term technical indicators. For NYSE:SCHW this score is currently 8:
Besides having an excellent technical rating, SCHW also presents a decent setup pattern. Prices have been consolidating lately and the volatility has been reduced. There is a resistance zone just above the current price starting at 82.61. Right above this resistance zone may be a good entry point. We notice that large players showed an interest for SCHW in the last couple of days, which is a good sign. Another positive sign is the recent Pocket Pivot signal.
How to trade NYSE:SCHW?
A breakout could materialize when the stock breaks out to new highs above the current consolidation zone. One could wait for this to happen and buy when this happens. A stop loss could be placed below the consolidation zone.
Disclaimer: This article is not intended to provide trading advice. It is crucial to conduct your own analysis and consider your own observations and trading style when making investment decisions. The article solely presents technical observations and should not be relied upon as a sole basis for trading.
More breakout setups can be found in our Breakout screener.
Keep in mind
Important Note: The content of this article is not intended as trading advice. It is essential to perform your own analysis and exercise caution when making trading decisions. The article presents observations created by automated analysis but does not guarantee any trading or investment outcomes. Always trade responsibly and make independent judgments.
80.18
+0.24 (+0.3%)
Find more stocks in the Stock Screener
SCHW Latest News and Analysis
 11 days ago - ChartmillTop S&P500 movers in Thursday's pre-market session
Let's have a look at what is happening on the US markets before the opening bell on Thursday. Below you can find the top S&P500 gainers and losers in today's pre-market session.
