
Technical Setup: STARBUCKS CORP Appears Poised for a Breakout.
By Mill Chart
Last update: Oct 23, 2024
Our stockscreener has identified a possible breakout setup on STARBUCKS CORP (NASDAQ:SBUX). This occurs when the stock consolidates following a significant upward movement. While the breakout outcome cannot be guaranteed, it may be worth monitoring NASDAQ:SBUX for potential opportunities.
In-Depth Technical Analysis of NASDAQ:SBUX
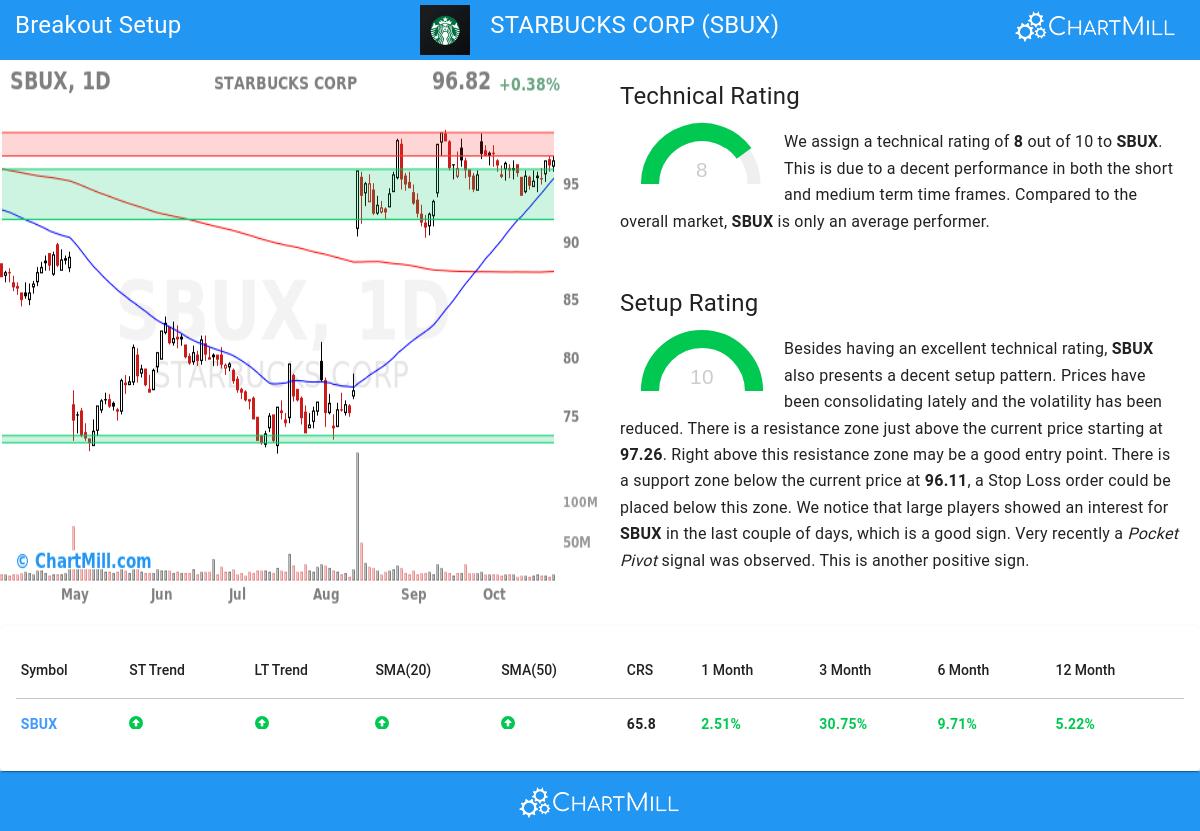
ChartMill assigns a Technical Rating to every stock. This score, ranging from 0 to 10, is updated daily and is determined by evaluating multiple technical indicators and properties.
Taking everything into account, SBUX scores 8 out of 10 in our technical rating. This is due to a decent performance in both the short and medium term time frames. Compared to the overall market, SBUX is only an average performer.
- The long and short term trends are both positive. This is looking good!
- When comparing the performance of all stocks over the past year, SBUX turns out to be only a medium performer in the overall market: it outperformed 65% of all stocks.
- SBUX is part of the Hotels, Restaurants & Leisure industry. There are 134 other stocks in this industry, SBUX did better than 63% of them.
- SBUX is currently trading in the middle of its 52 week range. The S&P500 Index however is currently trading near new highs, so SBUX is lagging the market.
- In the last month SBUX has a been trading in a tight range between 93.76 and 99.15.
For an up to date full technical analysis you can check the technical report of SBUX
Looking at the Setup
Besides the Technical Rating, ChartMill also assign a Setup Rating to every stock. This setup score also ranges from 0 to 10 and determines to which extend the stock is consolidating. This is achieved by evaluating multiple short term technical indicators. NASDAQ:SBUX currently has a 10 as setup rating:
SBUX has an excellent technical rating and also presents a decent setup pattern. We see reduced volatility while prices have been consolidating in the most recent period. There is a resistance zone just above the current price starting at 97.26. Right above this resistance zone may be a good entry point. There is a support zone below the current price at 96.11, a Stop Loss order could be placed below this zone. We notice that large players showed an interest for SBUX in the last couple of days, which is a good sign. Very recently a Pocket Pivot signal was observed. This is another positive sign.
How can NASDAQ:SBUX be traded?
One way to play this would be to wait for the actual breakout to happen and buy when the stock breaks out above the current consolidation zone. A possible place for a stop loss would be below this zone.
Important Note: The content of this article is not intended as trading advice. It is essential to perform your own analysis and exercise caution when making trading decisions. The article presents technical observations generated by automated analysis but does not guarantee any trading outcomes. Always trade responsibly and make independent judgments.
Every day, new breakout setups can be found on ChartMill in our Breakout screener.
Keep in mind
This is not investing advice! The article highlights some of the observations at the time of writing, but you should always make your own analysis and invest based on your own insights.
NASDAQ:SBUX (12/17/2025, 10:23:08 AM)
85.65
+0.57 (+0.67%)
Find more stocks in the Stock Screener
