
A technical analysis of ROKU INC.
By Mill Chart
Last update: Feb 10, 2025
Our stockscreener has identified a possible breakout setup on ROKU INC (NASDAQ:ROKU). This occurs when the stock consolidates following a significant upward movement. While the breakout outcome cannot be guaranteed, it may be worth monitoring NASDAQ:ROKU for potential opportunities.
In-Depth Technical Analysis of NASDAQ:ROKU
ChartMill utilizes a proprietary algorithm to assign a Technical Rating to every stock. This rating, ranging from 0 to 10, is computed daily by analyzing a variety of technical indicators and properties.
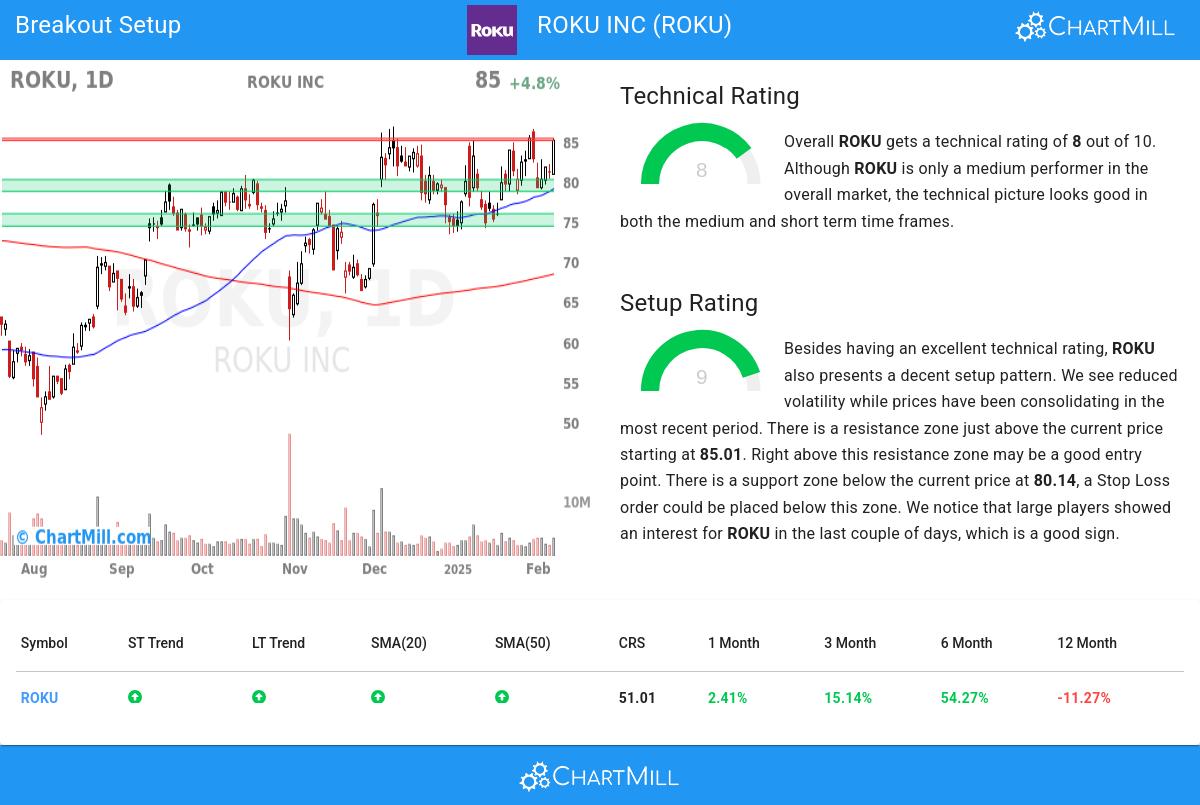
We assign a technical rating of 8 out of 10 to ROKU. Although ROKU is only a medium performer in the overall market, the technical picture looks good in both the medium and short term time frames.
- Both the short term and long term trends are positive. This is a very positive sign.
- In the last month ROKU has a been trading in the 74.10 - 86.41 range, which is quite wide. It is currently trading near the high of this range.
- When comparing the performance of all stocks over the past year, ROKU turns out to be only a medium performer in the overall market: it outperformed 51% of all stocks.
- ROKU is an average performer in the Entertainment industry, it outperforms 51% of 71 stocks in the same industry.
- ROKU is currently trading in the middle of its 52 week range. The S&P500 Index however is currently trading near new highs, so ROKU is lagging the market.
Our latest full technical report of ROKU contains the most current technical analsysis.
Looking at the Setup
Next to the Technical Rating, the Setup Rating of a stock determines to which extend the stock is consolidating. This score also ranges from 0 to 10 and is updated daily. The setup score evaluates various short term technical indicators. For NASDAQ:ROKU this score is currently 9:
ROKU has an excellent technical rating and also presents a decent setup pattern. Prices have been consolidating lately and the volatility has been reduced. There is a resistance zone just above the current price starting at 85.01. Right above this resistance zone may be a good entry point. There is a support zone below the current price at 80.14, a Stop Loss order could be placed below this zone. We notice that large players showed an interest for ROKU in the last couple of days, which is a good sign.
How can NASDAQ:ROKU be traded?
One way to play this would be to wait for the actual breakout to happen and buy when the stock breaks out above the current consolidation zone. A possible place for a stop loss would be below this zone.
Please note that this article should not be construed as trading advice. The information provided is solely based on automated technical analysis and serves to highlight technical observations. It is important to conduct your own analysis and make trading decisions based on your own judgment and responsibility.
More breakout setups can be found in our Breakout screener.
Keep in mind
Important Note: The content of this article is not intended as trading advice. It is essential to perform your own analysis and exercise caution when making trading decisions. The article presents observations created by automated analysis but does not guarantee any trading or investment outcomes. Always trade responsibly and make independent judgments.
