
A technical analysis of ROKU INC.
By Mill Chart
Last update: Oct 16, 2024
Our stock screener has spotted ROKU INC (NASDAQ:ROKU) as a possible breakout candidate. A technical breakout setup pattern occurs when the stock is consolidating after a nice uptrend. Whether the actual breakout occurs remains to be seen of course, but it may be interesting to keep an eye on NASDAQ:ROKU.
Deciphering the Technical Picture of NASDAQ:ROKU
ChartMill assigns a proprietary Technical Rating to each stock. The score is computed daily by evaluating various technical indicators and properties. The score ranges from 0 to 10.
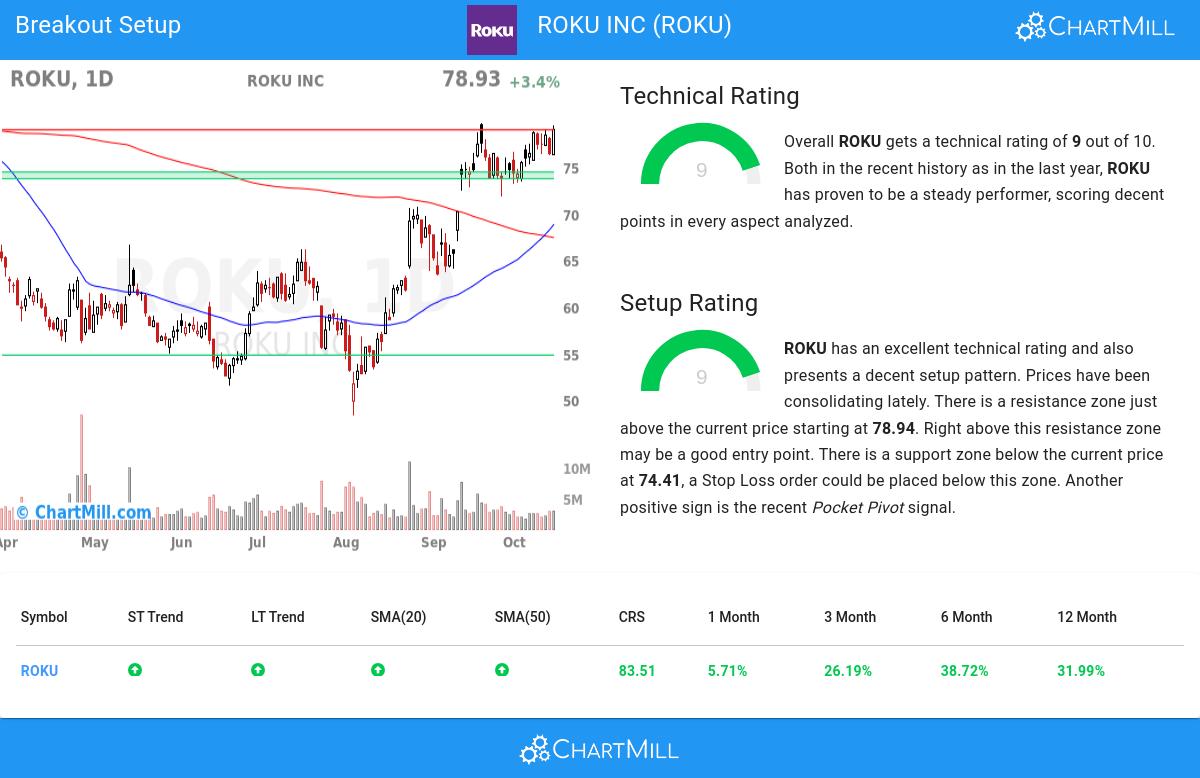
We assign a technical rating of 9 out of 10 to ROKU. Both in the recent history as in the last year, ROKU has proven to be a steady performer, scoring decent points in every aspect analyzed.
- The long and short term trends are both positive. This is looking good!
- ROKU is one of the better performing stocks in the Entertainment industry, it outperforms 74% of 72 stocks in the same industry.
- In the last month ROKU has a been trading in the 71.74 - 79.65 range, which is quite wide. It is currently trading near the high of this range.
- Looking at the yearly performance, ROKU did better than 83% of all other stocks. However, this overall performance is mostly based on the strong move around 10 months ago.
- ROKU is currently trading in the middle of its 52 week range. The S&P500 Index however is currently trading near new highs, so ROKU is lagging the market.
Check the latest full technical report of ROKU for a complete technical analysis.
How does the Setup look for NASDAQ:ROKU
In addition to the Technical Rating, ChartMill provides a Setup Rating for each stock. This rating, ranging from 0 to 10, assesses the extent of consolidation in the stock based on multiple short-term technical indicators. Currently, NASDAQ:ROKU has a 9 as its setup rating:
ROKU has an excellent technical rating and also presents a decent setup pattern. Prices have been consolidating lately. There is a resistance zone just above the current price starting at 78.94. Right above this resistance zone may be a good entry point. There is a support zone below the current price at 74.41, a Stop Loss order could be placed below this zone. Very recently a Pocket Pivot signal was observed. This is another positive sign.
Trading breakout setups.
For a potential trade one would typically wait until the stock breaks out of the consolidation zone to enter the stock and it could be sold again for a loss when it would fall back below the zone.
Please note that this article should not be construed as trading advice. The information provided is solely based on automated technical analysis and serves to highlight technical observations. It is important to conduct your own analysis and make trading decisions based on your own judgment and responsibility.
Every day, new breakout setups can be found on ChartMill in our Breakout screener.
Disclaimer
This article should in no way be interpreted as advice. The article is based on the observed metrics at the time of writing, but you should always make your own analysis and trade or invest at your own responsibility.