
Balancing Dividends and Fundamentals: The Case of NYSE:ROK.
By Mill Chart
Last update: Oct 17, 2024
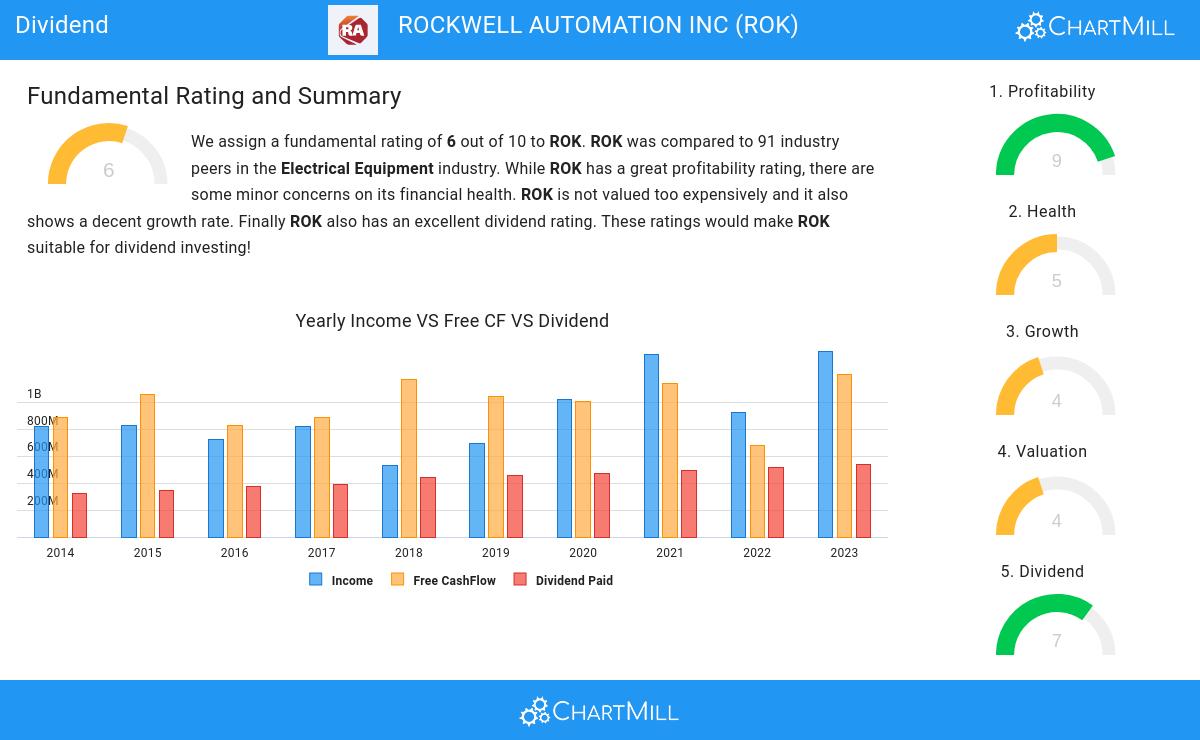
ROCKWELL AUTOMATION INC (NYSE:ROK) was identified as a stock worth exploring by dividend investors by our stock screener. NYSE:ROK scores well on profitability, solvency and liquidity. At the same time it seems to pay a decent dividend. We'll explore this a bit deeper below.
Assessing Dividend for NYSE:ROK
To gauge a stock's dividend quality, ChartMill utilizes a Dividend Rating ranging from 0 to 10. This comprehensive assessment considers various dividend aspects, including yield, history, growth, and sustainability. NYSE:ROK has achieved a 7 out of 10:
- ROK's Dividend Yield is rather good when compared to the industry average which is at 2.19. ROK pays more dividend than 94.38% of the companies in the same industry.
- ROK has been paying a dividend for at least 10 years, so it has a reliable track record.
- ROK has not decreased their dividend for at least 10 years, which is a reliable track record.
- ROK's earnings are growing more than its dividend. This makes the dividend growth sustainable.
What does the Health looks like for NYSE:ROK
ChartMill assigns a proprietary Health Rating to each stock. The score is computed by evaluating various liquidity and solvency ratios and ranges from 0 to 10. NYSE:ROK was assigned a score of 5 for health:
- ROK has an Altman-Z score of 4.77. This indicates that ROK is financially healthy and has little risk of bankruptcy at the moment.
- ROK's Altman-Z score of 4.77 is amongst the best of the industry. ROK outperforms 85.39% of its industry peers.
- The Debt to FCF ratio of ROK is 3.52, which is a good value as it means it would take ROK, 3.52 years of fcf income to pay off all of its debts.
- The Debt to FCF ratio of ROK (3.52) is better than 73.03% of its industry peers.
Understanding NYSE:ROK's Profitability
ChartMill assigns a Profitability Rating to every stock. This score ranges from 0 to 10 and evaluates the different profitability ratios and margins, both absolutely, but also relative to the industry peers. NYSE:ROK scores a 9 out of 10:
- ROK has a Return On Assets of 9.04%. This is amongst the best in the industry. ROK outperforms 89.89% of its industry peers.
- ROK has a Return On Equity of 30.42%. This is amongst the best in the industry. ROK outperforms 95.51% of its industry peers.
- ROK has a Return On Invested Capital of 14.43%. This is amongst the best in the industry. ROK outperforms 95.51% of its industry peers.
- ROK had an Average Return On Invested Capital over the past 3 years of 14.22%. This is above the industry average of 10.94%.
- The last Return On Invested Capital (14.43%) for ROK is above the 3 year average (14.22%), which is a sign of increasing profitability.
- Looking at the Profit Margin, with a value of 11.51%, ROK belongs to the top of the industry, outperforming 89.89% of the companies in the same industry.
- ROK's Profit Margin has improved in the last couple of years.
- ROK has a Operating Margin of 16.34%. This is amongst the best in the industry. ROK outperforms 92.13% of its industry peers.
- The Gross Margin of ROK (39.56%) is better than 91.01% of its industry peers.
More Best Dividend stocks can be found in our Best Dividend screener.
Check the latest full fundamental report of ROK for a complete fundamental analysis.
Keep in mind
This article should in no way be interpreted as advice. The article is based on the observed metrics at the time of writing, but you should always make your own analysis and trade or invest at your own responsibility.
NYSE:ROK (2/19/2025, 3:58:05 PM)
299.27
-1.88 (-0.62%)
Find more stocks in the Stock Screener
ROK Latest News and Analysis
 9 days ago - ChartmillUncover the latest developments among S&P500 stocks in today's session.
Wondering what's happening in today's session for the S&P500 index? Stay informed with the top movers within the S&P500 index on Monday.
 9 days ago - ChartmillIn today's session, there are S&P500 stocks with remarkable trading volume.
Let's take a closer look at the S&P500 stocks with an unusual volume in today's session on Monday. Stay informed about the market activity below.
9 days ago - ChartmillUncover the latest developments among S&P500 stocks in today's session.Curious about the S&P500 stocks that are in motion on Monday? Join us as we explore the top movers within the S&P500 index during today's session.
 9 days ago - ChartmillThese S&P500 stocks are moving in today's pre-market session
Discover the top S&P500 movers in Monday's pre-market session and stay informed about market dynamics.
