Don't overlook RAMBUS INC (NASDAQ:RMBS)—a stock with solid growth prospects and a reasonable valuation.
By Mill Chart
Last update: Mar 26, 2025
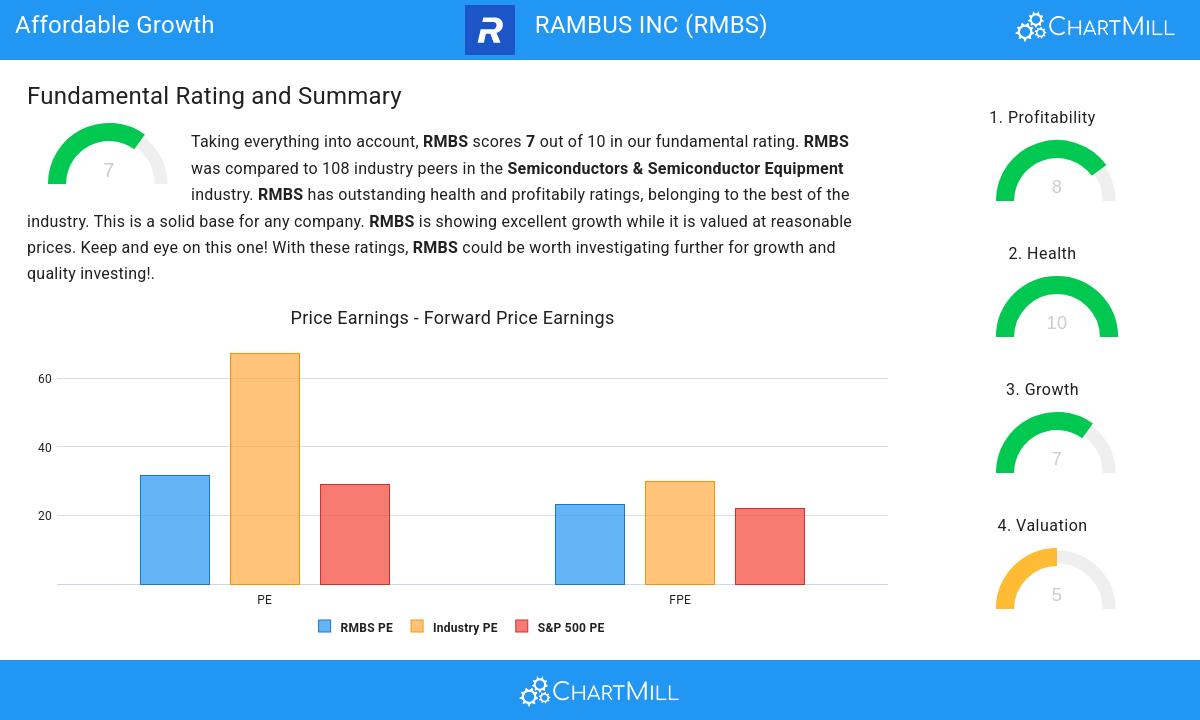
Our stock screener has singled out RAMBUS INC (NASDAQ:RMBS) as an attractive growth opportunity. RMBS is demonstrating remarkable growth potential while maintaining strong financial indicators, making it a reasonably priced option. We'll explore this further.
Evaluating Growth: RMBS
ChartMill assigns a Growth Rating to every stock. This score ranges from 0 to 10 and evaluates the different growth aspects like EPS and Revenue, both in the past as in the future. RMBS scores a 7 out of 10:
- The Earnings Per Share has been growing by 14.14% on average over the past years. This is quite good.
- The Revenue has grown by 20.71% in the past year. This is a very strong growth!
- Measured over the past years, RMBS shows a quite strong growth in Revenue. The Revenue has been growing by 19.59% on average per year.
- Based on estimates for the next years, RMBS will show a very strong growth in Earnings Per Share. The EPS will grow by 21.01% on average per year.
- RMBS is expected to show quite a strong growth in Revenue. In the coming years, the Revenue will grow by 9.86% yearly.
- When comparing the EPS growth rate of the last years to the growth rate of the upcoming years, we see that the growth is accelerating.
Valuation Assessment of RMBS
To assess a stock's valuation, ChartMill utilizes a Valuation Rating on a scale of 0 to 10. This comprehensive assessment considers various valuation aspects, comparing price to earnings and cash flows, while factoring in profitability and growth. RMBS has achieved a 5 out of 10:
- 62.04% of the companies in the same industry are more expensive than RMBS, based on the Price/Earnings ratio.
- Compared to the rest of the industry, the Price/Forward Earnings ratio of RMBS indicates a somewhat cheap valuation: RMBS is cheaper than 69.44% of the companies listed in the same industry.
- Compared to the rest of the industry, the Enterprise Value to EBITDA ratio of RMBS indicates a somewhat cheap valuation: RMBS is cheaper than 63.89% of the companies listed in the same industry.
- 71.30% of the companies in the same industry are more expensive than RMBS, based on the Price/Free Cash Flow ratio.
- RMBS's low PEG Ratio(NY), which compensates the Price/Earnings for growth, indicates a rather cheap valuation of the company.
- The excellent profitability rating of RMBS may justify a higher PE ratio.
- RMBS's earnings are expected to grow with 22.11% in the coming years. This may justify a more expensive valuation.
Exploring RMBS's Health
To gauge a stock's financial health, ChartMill utilizes a Health Rating on a scale of 0 to 10. This comprehensive evaluation encompasses liquidity and solvency, both in absolute terms and in comparison to industry peers. RMBS has earned a 10 out of 10:
- RMBS has an Altman-Z score of 18.24. This indicates that RMBS is financially healthy and has little risk of bankruptcy at the moment.
- RMBS has a better Altman-Z score (18.24) than 87.96% of its industry peers.
- RMBS has no outstanding debt. Therefor its Debt/Equity and Debt/FCF ratios are 0 and belong to the best of the industry.
- RMBS has a Current Ratio of 8.44. This indicates that RMBS is financially healthy and has no problem in meeting its short term obligations.
- RMBS's Current ratio of 8.44 is amongst the best of the industry. RMBS outperforms 94.44% of its industry peers.
- RMBS has a Quick Ratio of 7.89. This indicates that RMBS is financially healthy and has no problem in meeting its short term obligations.
- With an excellent Quick ratio value of 7.89, RMBS belongs to the best of the industry, outperforming 96.30% of the companies in the same industry.
Profitability Examination for RMBS
ChartMill utilizes a Profitability Rating to assess stocks, scoring them on a scale of 0 to 10. This rating takes into account a variety of profitability ratios and margins, both in absolute terms and in comparison to industry peers. RMBS has earned a 8 out of 10:
- RMBS's Return On Assets of 13.39% is amongst the best of the industry. RMBS outperforms 83.33% of its industry peers.
- RMBS has a better Return On Equity (16.05%) than 77.78% of its industry peers.
- The Return On Invested Capital of RMBS (13.18%) is better than 84.26% of its industry peers.
- The 3 year average ROIC (9.26%) for RMBS is below the current ROIC(13.18%), indicating increased profibility in the last year.
- With an excellent Profit Margin value of 32.31%, RMBS belongs to the best of the industry, outperforming 93.52% of the companies in the same industry.
- In the last couple of years the Profit Margin of RMBS has grown nicely.
- RMBS has a Operating Margin of 33.21%. This is amongst the best in the industry. RMBS outperforms 93.52% of its industry peers.
- In the last couple of years the Operating Margin of RMBS has grown nicely.
- RMBS has a Gross Margin of 80.22%. This is amongst the best in the industry. RMBS outperforms 97.22% of its industry peers.
Every day, new Affordable Growth stocks can be found on ChartMill in our Affordable Growth screener.
For an up to date full fundamental analysis you can check the fundamental report of RMBS
Disclaimer
This article should in no way be interpreted as advice. The article is based on the observed metrics at the time of writing, but you should always make your own analysis and trade or invest at your own responsibility.
45.72
-0.2 (-0.44%)
Find more stocks in the Stock Screener
RMBS Latest News and Analysis
 19 hours ago - ChartmillRAMBUS INC (NASDAQ:RMBS) is showing good growth, while it is not too expensive.
Discover RAMBUS INC, an undervalued growth gem. NASDAQ:RMBS is shining in terms of growth metrics, and it's also displaying strong financial health and profitability, retaining an appealing valuation.
