Why the dividend investor may take a look at NYSE:RHI.
By Mill Chart
Last update: Oct 9, 2024
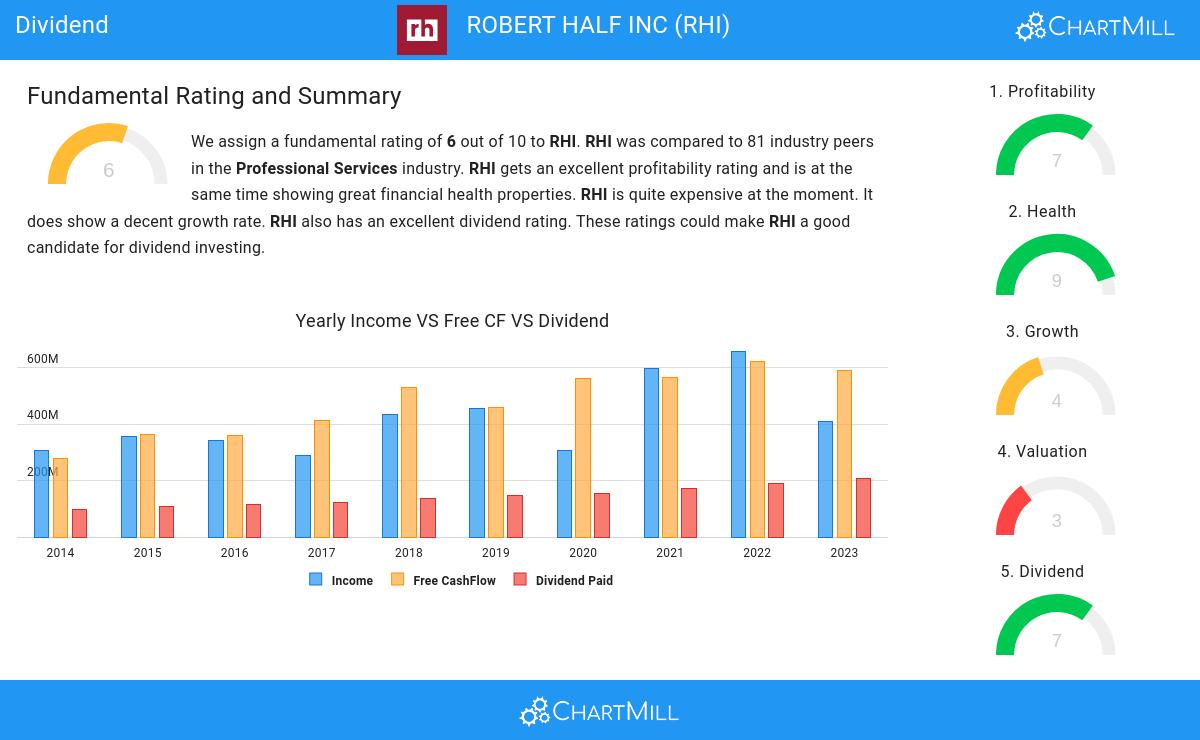
ROBERT HALF INC (NYSE:RHI) has caught the attention of dividend investors as a stock worth considering. NYSE:RHI excels in profitability, solvency, and liquidity, all while providing a decent dividend. Let's delve into the details.
Assessing Dividend Metrics for NYSE:RHI
ChartMill employs its own Dividend Rating system for all stocks. This score, on a scale of 0 to 10, is determined by evaluating different dividend factors, such as yield, historical performance, dividend growth, and sustainability. NYSE:RHI has been assigned a 7 for dividend:
- RHI's Dividend Yield is rather good when compared to the industry average which is at 1.73. RHI pays more dividend than 96.25% of the companies in the same industry.
- Compared to an average S&P500 Dividend Yield of 2.22, RHI pays a bit more dividend than the S&P500 average.
- On average, the dividend of RHI grows each year by 11.53%, which is quite nice.
- RHI has been paying a dividend for at least 10 years, so it has a reliable track record.
- RHI has not decreased their dividend for at least 10 years, which is a reliable track record.
- The dividend of RHI is growing, but earnings are growing more, so the dividend growth is sustainable.
Looking at the Health
ChartMill utilizes a Health Rating to assess stocks, scoring them on a scale of 0 to 10. This rating takes into account a variety of liquidity and solvency ratios, both in absolute terms and in comparison to industry peers. NYSE:RHI has earned a 9 out of 10:
- RHI has an Altman-Z score of 5.73. This indicates that RHI is financially healthy and has little risk of bankruptcy at the moment.
- With an excellent Altman-Z score value of 5.73, RHI belongs to the best of the industry, outperforming 86.25% of the companies in the same industry.
- There is no outstanding debt for RHI. This means it has a Debt/Equity and Debt/FCF ratio of 0 and it is amongst the best of the sector and industry.
- RHI has a better Current ratio (1.76) than 66.25% of its industry peers.
- RHI's Quick ratio of 1.76 is fine compared to the rest of the industry. RHI outperforms 66.25% of its industry peers.
Understanding NYSE:RHI's Profitability
ChartMill employs its own Profitability Rating system for stock evaluation. This score, ranging from 0 to 10, is derived from an analysis of diverse profitability metrics and margins. In the case of NYSE:RHI, the assigned 7 is noteworthy for profitability:
- RHI has a Return On Assets of 10.71%. This is amongst the best in the industry. RHI outperforms 85.00% of its industry peers.
- RHI's Return On Equity of 21.26% is fine compared to the rest of the industry. RHI outperforms 77.50% of its industry peers.
- RHI's Return On Invested Capital of 14.11% is fine compared to the rest of the industry. RHI outperforms 76.25% of its industry peers.
- Measured over the past 3 years, the Average Return On Invested Capital for RHI is significantly above the industry average of 12.67%.
- The last Return On Invested Capital (14.11%) for RHI is well below the 3 year average (30.99%), which needs to be investigated, but indicates that RHI had better years and this may not be a problem.
- The Profit Margin of RHI (5.26%) is better than 67.50% of its industry peers.
Every day, new Best Dividend stocks can be found on ChartMill in our Best Dividend screener.
For an up to date full fundamental analysis you can check the fundamental report of RHI
Disclaimer
This article should in no way be interpreted as advice. The article is based on the observed metrics at the time of writing, but you should always make your own analysis and trade or invest at your own responsibility.
59.09
+0.64 (+1.09%)
Find more stocks in the Stock Screener
RHI Latest News and Analysis
 12 days ago - ChartmillWhy NYSE:RHI is a Top Pick for Dividend Investors.
Is ROBERT HALF INC (NYSE:RHI) suited for dividend investing?
