Analyzing NYSE:RHI's Dividend Potential.
By Mill Chart
Last update: Sep 9, 2024
Unearth the potential of ROBERT HALF INC (NYSE:RHI) as a dividend stock recommended by our stock screening tool. NYSE:RHI maintains a robust financial footing and delivers a sustainable dividend. We'll delve into the details below.
Exploring NYSE:RHI's Dividend
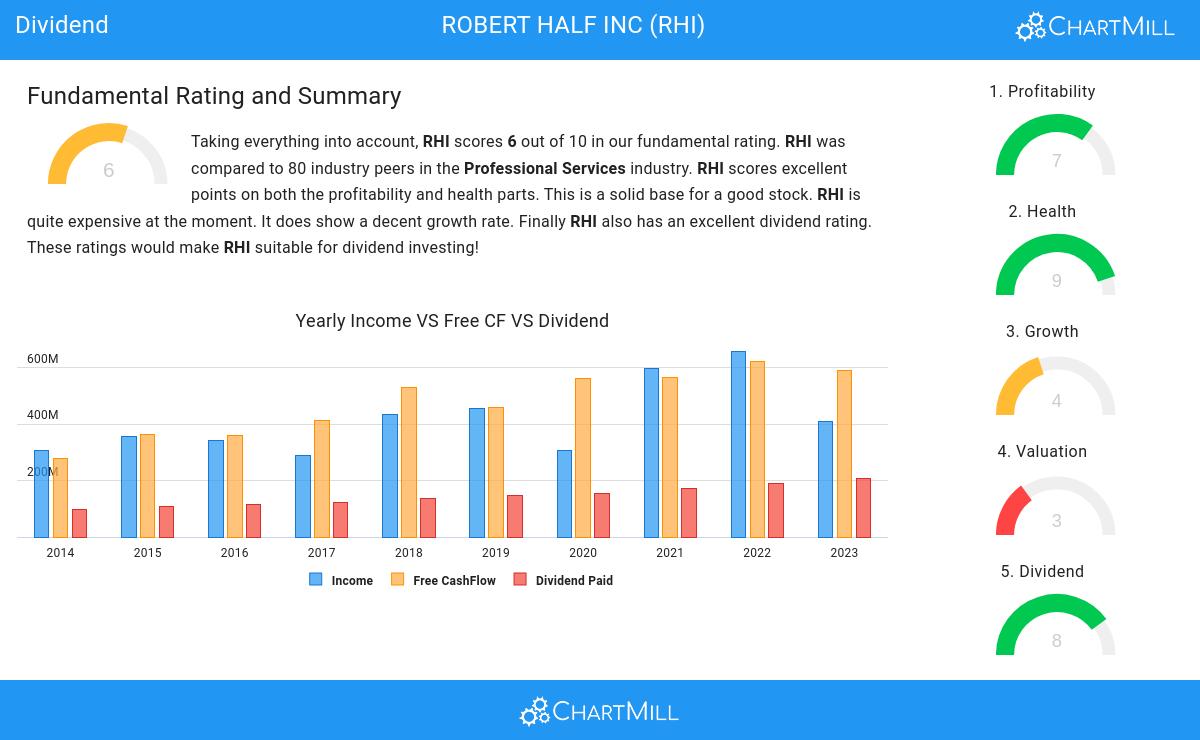
An integral part of ChartMill's stock analysis is the Dividend Rating, which spans from 0 to 10. This rating evaluates diverse dividend factors, including yield, historical data, growth, and sustainability. NYSE:RHI has received a 8 out of 10:
- Compared to an average industry Dividend Yield of 1.73, RHI pays a better dividend. On top of this RHI pays more dividend than 96.25% of the companies listed in the same industry.
- Compared to an average S&P500 Dividend Yield of 2.26, RHI pays a better dividend.
- On average, the dividend of RHI grows each year by 11.53%, which is quite nice.
- RHI has paid a dividend for at least 10 years, which is a reliable track record.
- RHI has not decreased their dividend for at least 10 years, which is a reliable track record.
- RHI's earnings are growing more than its dividend. This makes the dividend growth sustainable.
Understanding NYSE:RHI's Health
ChartMill assigns a proprietary Health Rating to each stock. The score is computed by evaluating various liquidity and solvency ratios and ranges from 0 to 10. NYSE:RHI was assigned a score of 9 for health:
- RHI has an Altman-Z score of 5.47. This indicates that RHI is financially healthy and has little risk of bankruptcy at the moment.
- With an excellent Altman-Z score value of 5.47, RHI belongs to the best of the industry, outperforming 86.25% of the companies in the same industry.
- There is no outstanding debt for RHI. This means it has a Debt/Equity and Debt/FCF ratio of 0 and it is amongst the best of the sector and industry.
- RHI has a better Current ratio (1.76) than 66.25% of its industry peers.
- RHI's Quick ratio of 1.76 is fine compared to the rest of the industry. RHI outperforms 66.25% of its industry peers.
A Closer Look at Profitability for NYSE:RHI
ChartMill's Profitability Rating offers a unique perspective on stock analysis, providing scores from 0 to 10. These ratings consider a wide range of profitability metrics and margins, both in comparison to industry peers and on their own merits. For NYSE:RHI, the assigned 7 is a significant indicator of profitability:
- RHI's Return On Assets of 10.71% is amongst the best of the industry. RHI outperforms 85.00% of its industry peers.
- Looking at the Return On Equity, with a value of 21.26%, RHI is in the better half of the industry, outperforming 77.50% of the companies in the same industry.
- RHI has a Return On Invested Capital of 14.11%. This is in the better half of the industry: RHI outperforms 76.25% of its industry peers.
- The Average Return On Invested Capital over the past 3 years for RHI is significantly above the industry average of 12.74%.
- The last Return On Invested Capital (14.11%) for RHI is well below the 3 year average (30.99%), which needs to be investigated, but indicates that RHI had better years and this may not be a problem.
- The Profit Margin of RHI (5.26%) is better than 67.50% of its industry peers.
More Best Dividend stocks can be found in our Best Dividend screener.
Check the latest full fundamental report of RHI for a complete fundamental analysis.
Keep in mind
Important Note: The content of this article is not intended as trading advice. It is essential to perform your own analysis and exercise caution when making trading decisions. The article presents observations created by automated analysis but does not guarantee any trading or investment outcomes. Always trade responsibly and make independent judgments.
54.98
-1.4 (-2.48%)
Find more stocks in the Stock Screener
RHI Latest News and Analysis
 13 days ago - ChartmillWhy NYSE:RHI is a Top Pick for Dividend Investors.
Is ROBERT HALF INC (NYSE:RHI) suited for dividend investing?
