
Uncovering Noteworthy Technical Analysis Findings for REGIONS FINANCIAL CORP (NYSE:RF).
By Mill Chart
Last update: Oct 10, 2024
Our stock screener has detected a potential breakout setup on REGIONS FINANCIAL CORP (NYSE:RF). This breakout pattern is observed when a stock consolidates following a strong upward movement. It's important to note that this pattern is based on technical analysis, and the actual breakout outcome is uncertain. However, it might be worth keeping an eye on NYSE:RF.
Technical analysis of NYSE:RF
ChartMill employs a sophisticated system to assign a Technical Rating to every stock in its analysis. This rating, which ranges from 0 to 10, is determined by carefully assessing multiple technical indicators and properties.
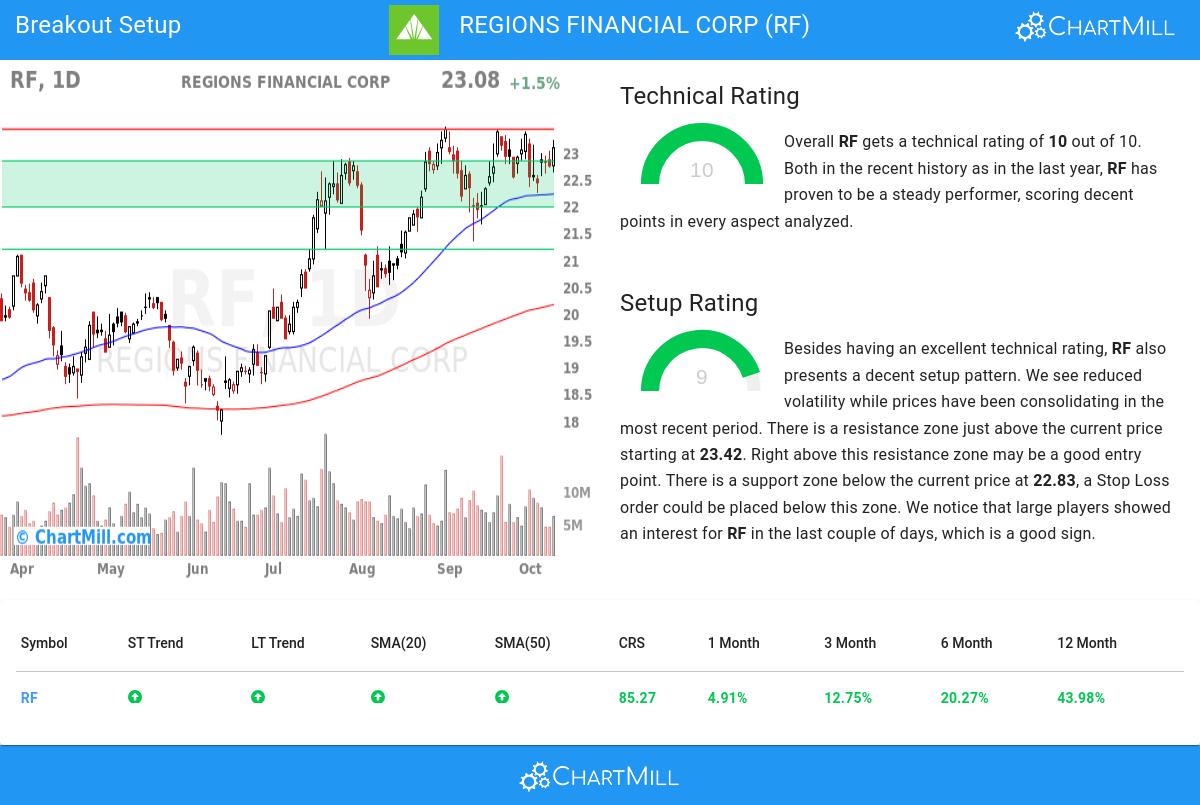
We assign a technical rating of 10 out of 10 to RF. Both in the recent history as in the last year, RF has proven to be a steady performer, scoring decent points in every aspect analyzed.
- The long and short term trends are both positive. This is looking good!
- When comparing the yearly performance of all stocks, we notice that RF is one of the better performing stocks in the market, outperforming 85% of all stocks. We also observe that the gains produced by RF over the past year are nicely spread over this period.
- RF is one of the better performing stocks in the Banks industry, it outperforms 75% of 406 stocks in the same industry.
- RF is currently trading near its 52 week high, which is a good sign. The S&P500 Index however is also trading near new highs, which makes the performance in line with the market.
- In the last month RF has a been trading in the 21.64 - 23.43 range, which is quite wide. It is currently trading near the high of this range.
- Prices have been consolidating recently, this may present a good entry opportunity.
For an up to date full technical analysis you can check the technical report of RF
Looking at the Setup
In addition to the Technical Rating, ChartMill provides a Setup Rating for each stock. This rating, ranging from 0 to 10, assesses the level of consolidation in the stock based on multiple short-term technical indicators. Currently, NYSE:RF has a 9 as its setup rating, indicating its current consolidation status.
Besides having an excellent technical rating, RF also presents a decent setup pattern. Prices have been consolidating lately and the volatility has been reduced. There is a resistance zone just above the current price starting at 23.42. Right above this resistance zone may be a good entry point. There is a support zone below the current price at 22.83, a Stop Loss order could be placed below this zone. We notice that large players showed an interest for RF in the last couple of days, which is a good sign.
How can NYSE:RF be traded?
For a potential trade one would typically wait until the stock breaks out of the consolidation zone to enter the stock and it could be sold again for a loss when it would fall back below the zone.
Important Note: The content of this article is not intended as trading advice. It is essential to perform your own analysis and exercise caution when making trading decisions. The article presents technical observations generated by automated analysis but does not guarantee any trading outcomes. Always trade responsibly and make independent judgments.
More breakout setups can be found in our Breakout screener.
Disclaimer
This article should in no way be interpreted as advice. The article is based on the observed metrics at the time of writing, but you should always make your own analysis and trade or invest at your own responsibility.
19.31
+0.14 (+0.73%)
Find more stocks in the Stock Screener
RF Latest News and Analysis
 13 hours ago - ChartmillWhich S&P500 stocks have an unusual volume on Thursday?
Let's have a look at what is happening on the US markets on Thursday. Below you can find the S&P500 stocks with an unusual volume in today's session.
