
Exploring REGIONS FINANCIAL CORP's Technical Signals and Breakout Potential.
By Mill Chart
Last update: Oct 1, 2024
REGIONS FINANCIAL CORP (NYSE:RF) was identified as a Technical Breakout Setup Pattern by our stockscreener. Such a pattern occurs when we see a pause in a strong uptrend: after a strong rise the stock is consolidating a bit and at some point the trend may be continued. Whether this actually happens can not be predicted of course, but it may be a good idea to keep and eye on NYSE:RF.
In-Depth Technical Analysis of NYSE:RF
As part of its analysis, ChartMill provides a comprehensive Technical Rating for each stock. This rating, ranging from 0 to 10, is updated on a daily basis and is based on the evaluation of various technical indicators and properties.
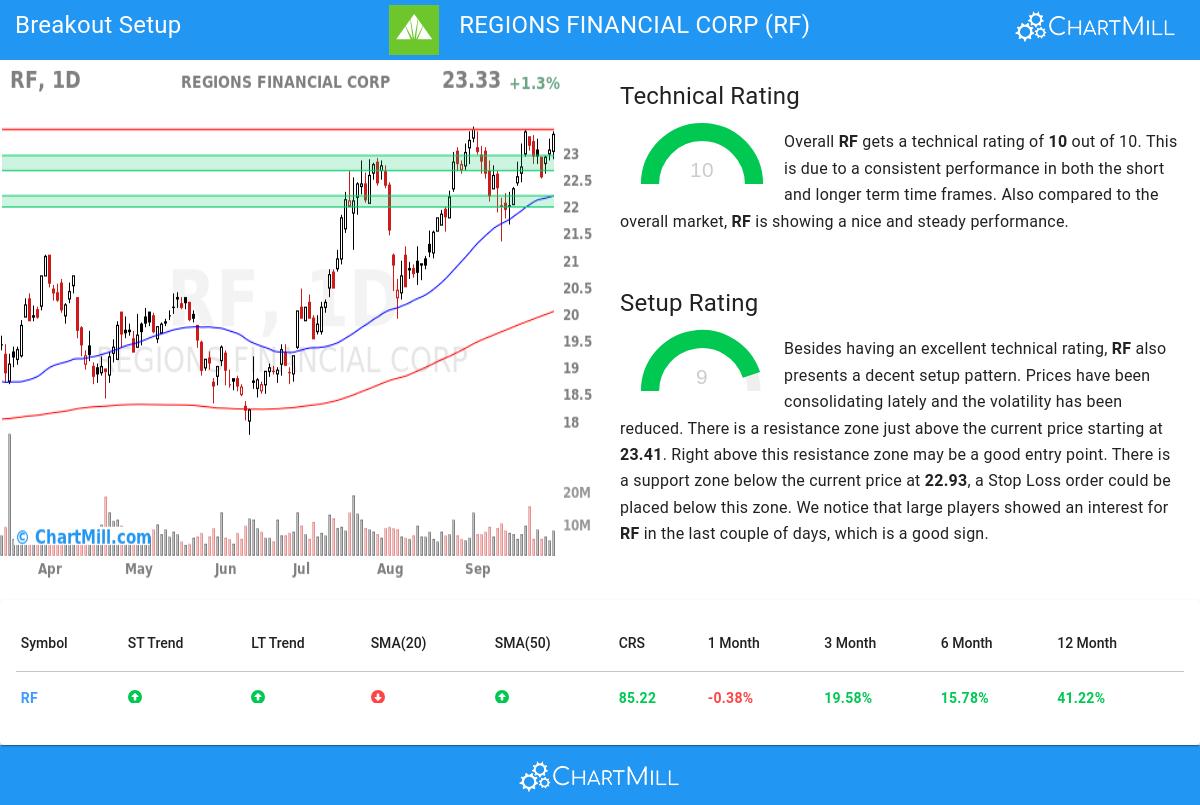
Overall RF gets a technical rating of 10 out of 10. Both in the recent history as in the last year, RF has proven to be a steady performer, scoring decent points in every aspect analyzed.
- Both the short term and long term trends are positive. This is a very positive sign.
- When comparing the yearly performance of all stocks, we notice that RF is one of the better performing stocks in the market, outperforming 85% of all stocks. We also observe that the gains produced by RF over the past year are nicely spread over this period.
- RF is currently trading near its 52 week high, which is a good sign. The S&P500 Index however is also trading near new highs, which makes the performance in line with the market.
- In the last month RF has a been trading in the 21.33 - 23.43 range, which is quite wide. It is currently trading near the high of this range.
- RF is part of the Banks industry. There are 404 other stocks in this industry, RF did better than 68% of them.
For an up to date full technical analysis you can check the technical report of RF
How does the Setup look for NYSE:RF
Next to the Technical Rating, the Setup Rating of a stock determines to which extend the stock is consolidating. This score also ranges from 0 to 10 and is updated daily. The setup score evaluates various short term technical indicators. For NYSE:RF this score is currently 9:
RF has an excellent technical rating and also presents a decent setup pattern. Prices have been consolidating lately and the volatility has been reduced. There is a resistance zone just above the current price starting at 23.41. Right above this resistance zone may be a good entry point. There is a support zone below the current price at 22.93, a Stop Loss order could be placed below this zone. We notice that large players showed an interest for RF in the last couple of days, which is a good sign.
Trading setups like NYSE:RF
A breakout could materialize when the stock breaks out to new highs above the current consolidation zone. One could wait for this to happen and buy when this happens. A stop loss could be placed below the consolidation zone.
Of course, there are many ways to trade or not trade NYSE:RF and this article should in no way be interpreted as trading advice. The article is purely based on an automated technical analysis and just points out the technical observations. Always make your own analysis and trade at your own responsibility.
Our Breakout screener lists more breakout setups and is updated daily.
Keep in mind
This article should in no way be interpreted as advice. The article is based on the observed metrics at the time of writing, but you should always make your own analysis and trade or invest at your own responsibility.
19.31
+0.14 (+0.73%)
Find more stocks in the Stock Screener
RF Latest News and Analysis
 13 hours ago - ChartmillWhich S&P500 stocks have an unusual volume on Thursday?
Let's have a look at what is happening on the US markets on Thursday. Below you can find the S&P500 stocks with an unusual volume in today's session.
