
In a market where value is scarce, REGENERON PHARMACEUTICALS (NASDAQ:REGN) offers a refreshing opportunity with its solid fundamentals.
By Mill Chart
Last update: Apr 2, 2025
REGENERON PHARMACEUTICALS (NASDAQ:REGN) is a hidden gem identified by our stock screening tool, featuring undervaluation and robust fundamentals. REGN showcases decent financial health and profitability, coupled with an attractive price. Let's dig deeper into the analysis.
Valuation Examination for REGN
ChartMill provides a Valuation Rating to every stock, ranging from 0 to 10. This rating assesses various valuation aspects, comparing price to earnings and cash flows, while considering factors like profitability and growth. REGN boasts a 7 out of 10:
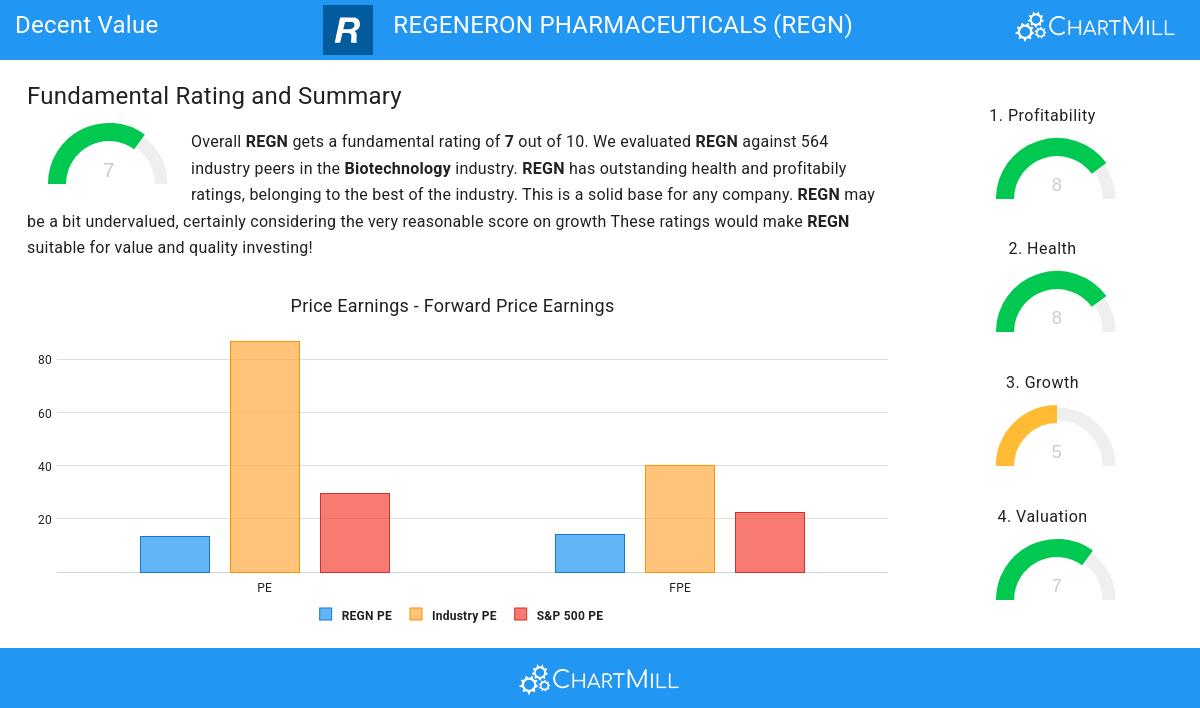
- 97.34% of the companies in the same industry are more expensive than REGN, based on the Price/Earnings ratio.
- REGN's Price/Earnings ratio indicates a rather cheap valuation when compared to the S&P500 average which is at 29.59.
- 95.92% of the companies in the same industry are more expensive than REGN, based on the Price/Forward Earnings ratio.
- When comparing the Price/Forward Earnings ratio of REGN to the average of the S&P500 Index (22.36), we can say REGN is valued slightly cheaper.
- REGN's Enterprise Value to EBITDA ratio is rather cheap when compared to the industry. REGN is cheaper than 98.40% of the companies in the same industry.
- REGN's Price/Free Cash Flow ratio is rather cheap when compared to the industry. REGN is cheaper than 95.74% of the companies in the same industry.
- REGN has an outstanding profitability rating, which may justify a higher PE ratio.
What does the Profitability looks like for REGN
ChartMill assigns a proprietary Profitability Rating to each stock. The score is computed by evaluating various profitability ratios and margins and ranges from 0 to 10. REGN was assigned a score of 8 for profitability:
- With an excellent Return On Assets value of 11.69%, REGN belongs to the best of the industry, outperforming 96.28% of the companies in the same industry.
- The Return On Equity of REGN (15.03%) is better than 95.74% of its industry peers.
- REGN has a better Return On Invested Capital (9.85%) than 95.57% of its industry peers.
- The Profit Margin of REGN (31.07%) is better than 97.87% of its industry peers.
- In the last couple of years the Profit Margin of REGN has grown nicely.
- With an excellent Operating Margin value of 29.70%, REGN belongs to the best of the industry, outperforming 98.23% of the companies in the same industry.
- REGN's Gross Margin of 87.01% is amongst the best of the industry. REGN outperforms 89.18% of its industry peers.
How do we evaluate the Health for REGN?
To gauge a stock's financial health, ChartMill utilizes a Health Rating on a scale of 0 to 10. This comprehensive evaluation encompasses liquidity and solvency, both in absolute terms and in comparison to industry peers. REGN has earned a 8 out of 10:
- An Altman-Z score of 7.20 indicates that REGN is not in any danger for bankruptcy at the moment.
- With an excellent Altman-Z score value of 7.20, REGN belongs to the best of the industry, outperforming 85.99% of the companies in the same industry.
- REGN has a debt to FCF ratio of 0.76. This is a very positive value and a sign of high solvency as it would only need 0.76 years to pay back of all of its debts.
- With an excellent Debt to FCF ratio value of 0.76, REGN belongs to the best of the industry, outperforming 95.39% of the companies in the same industry.
- A Debt/Equity ratio of 0.09 indicates that REGN is not too dependend on debt financing.
- Although REGN does not score too well on debt/equity it has very limited outstanding debt, which is well covered by the FCF. We will not put too much weight on the debt/equity number as it may be because of low equity, which could be a consequence of a share buyback program for instance. This needs to be investigated.
- REGN has a Current Ratio of 4.73. This indicates that REGN is financially healthy and has no problem in meeting its short term obligations.
- REGN has a Quick Ratio of 3.95. This indicates that REGN is financially healthy and has no problem in meeting its short term obligations.
ChartMill's Evaluation of Growth
Every stock receives a Growth Rating from ChartMill, ranging from 0 to 10. This rating assesses various growth aspects, including historical and projected EPS and revenue growth. REGN boasts a 5 out of 10:
- Measured over the past years, REGN shows a quite strong growth in Earnings Per Share. The EPS has been growing by 13.12% on average per year.
- The Revenue has grown by 8.27% in the past year. This is quite good.
- The Revenue has been growing by 12.55% on average over the past years. This is quite good.
- The Earnings Per Share is expected to grow by 9.65% on average over the next years. This is quite good.
More Decent Value stocks can be found in our Decent Value screener.
Our latest full fundamental report of REGN contains the most current fundamental analsysis.
Disclaimer
This article should in no way be interpreted as advice. The article is based on the observed metrics at the time of writing, but you should always make your own analysis and trade or invest at your own responsibility.
599.76
+11.91 (+2.03%)
Find more stocks in the Stock Screener
REGN Latest News and Analysis
 4 days ago - ChartmillDiscover which S&P500 stocks are making waves on Monday.
Curious about the S&P500 stocks that are in motion on Monday? Join us as we explore the top movers within the S&P500 index during today's session.
 16 days ago - ChartmillThese S&P500 stocks are gapping in today's session
Let's have a look at the S&P500 gap up and gap down stocks in today's session.
