Why RADIAN GROUP INC (NYSE:RDN) is a Top Pick for Dividend Investors.
By Mill Chart
Last update: Feb 27, 2025
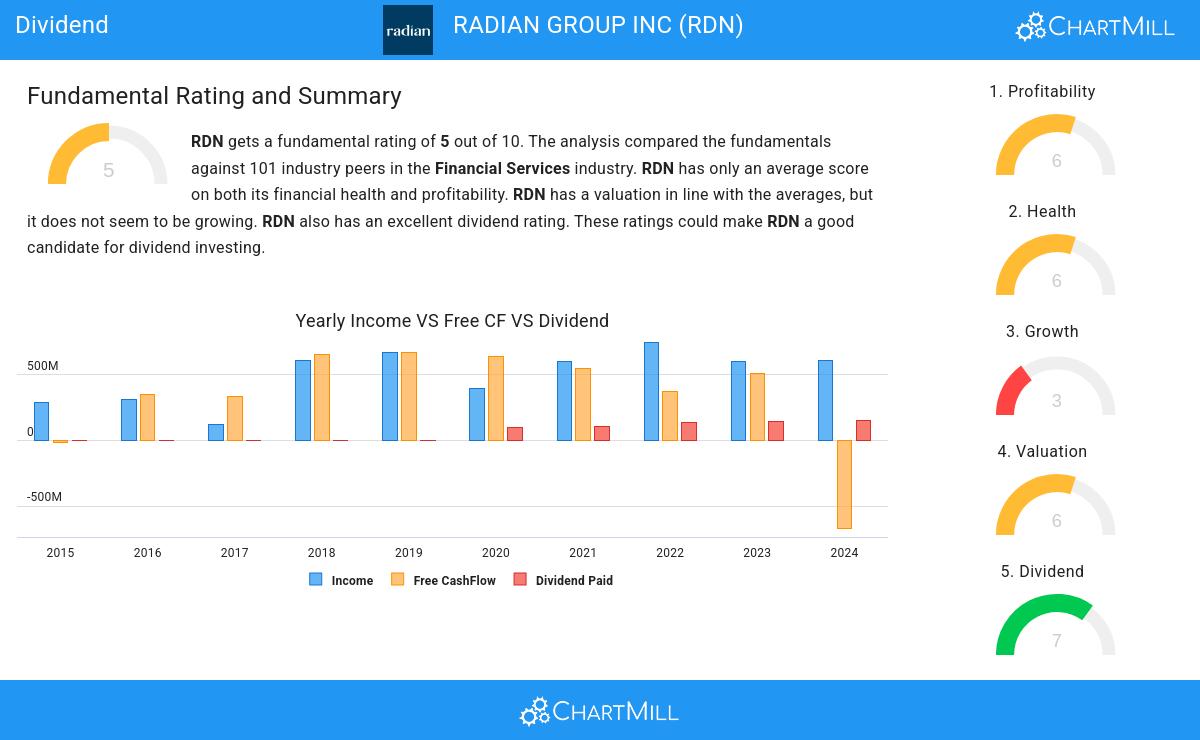
Our stock screening tool has identified RADIAN GROUP INC (NYSE:RDN) as a strong dividend contender with robust fundamentals. NYSE:RDN exhibits commendable financial health and profitability, all while offering a sustainable dividend. Let's delve into each aspect below.
A Closer Look at Dividend for NYSE:RDN
To gauge a stock's dividend quality, ChartMill utilizes a Dividend Rating ranging from 0 to 10. This comprehensive assessment considers various dividend aspects, including yield, history, growth, and sustainability. NYSE:RDN has achieved a 7 out of 10:
- RDN's Dividend Yield is rather good when compared to the industry average which is at 3.85. RDN pays more dividend than 81.19% of the companies in the same industry.
- Compared to an average S&P500 Dividend Yield of 2.27, RDN pays a bit more dividend than the S&P500 average.
- On average, the dividend of RDN grows each year by 151.22%, which is quite nice.
- RDN has paid a dividend for at least 10 years, which is a reliable track record.
- RDN has not decreased their dividend for at least 10 years, which is a reliable track record.
- RDN pays out 25.14% of its income as dividend. This is a sustainable payout ratio.
Assessing Health for NYSE:RDN
Every stock is evaluated by ChartMill, receiving a Health Rating on a scale of 0 to 10. This assessment considers different health aspects, including liquidity and solvency, both in absolute terms and relative to industry peers. NYSE:RDN has achieved a 6 out of 10:
- RDN has a better Altman-Z score (1.97) than 70.30% of its industry peers.
- A Debt/Equity ratio of 0.50 indicates that RDN is not too dependend on debt financing.
- A Current Ratio of 3.42 indicates that RDN has no problem at all paying its short term obligations.
- The Current ratio of RDN (3.42) is better than 86.14% of its industry peers.
- RDN has a Quick Ratio of 3.42. This indicates that RDN is financially healthy and has no problem in meeting its short term obligations.
- RDN has a better Quick ratio (3.42) than 87.13% of its industry peers.
A Closer Look at Profitability for NYSE:RDN
ChartMill employs its own Profitability Rating system for stock evaluation. This score, ranging from 0 to 10, is derived from an analysis of diverse profitability metrics and margins. In the case of NYSE:RDN, the assigned 6 is noteworthy for profitability:
- Looking at the Return On Assets, with a value of 6.98%, RDN belongs to the top of the industry, outperforming 82.18% of the companies in the same industry.
- RDN's Return On Invested Capital of 8.25% is amongst the best of the industry. RDN outperforms 80.20% of its industry peers.
- The Average Return On Invested Capital over the past 3 years for RDN is above the industry average of 7.71%.
- RDN has a better Profit Margin (46.85%) than 92.08% of its industry peers.
- RDN has a better Operating Margin (70.27%) than 93.07% of its industry peers.
- In the last couple of years the Operating Margin of RDN has grown nicely.
More Best Dividend stocks can be found in our Best Dividend screener.
For an up to date full fundamental analysis you can check the fundamental report of RDN
Disclaimer
Important Note: The content of this article is not intended as trading advice. It is essential to perform your own analysis and exercise caution when making trading decisions. The article presents observations created by automated analysis but does not guarantee any trading or investment outcomes. Always trade responsibly and make independent judgments.
31.6
+0.22 (+0.7%)
Find more stocks in the Stock Screener
RDN Latest News and Analysis
 9 days ago - ChartmillBalancing Dividends and Fundamentals: The Case of RADIAN GROUP INC (NYSE:RDN).
Is RADIAN GROUP INC (NYSE:RDN) a Good Fit for Dividend Investing?
