
Is NYSE:RDN a Good Fit for Dividend Investing?
By Mill Chart
Last update: Oct 9, 2024
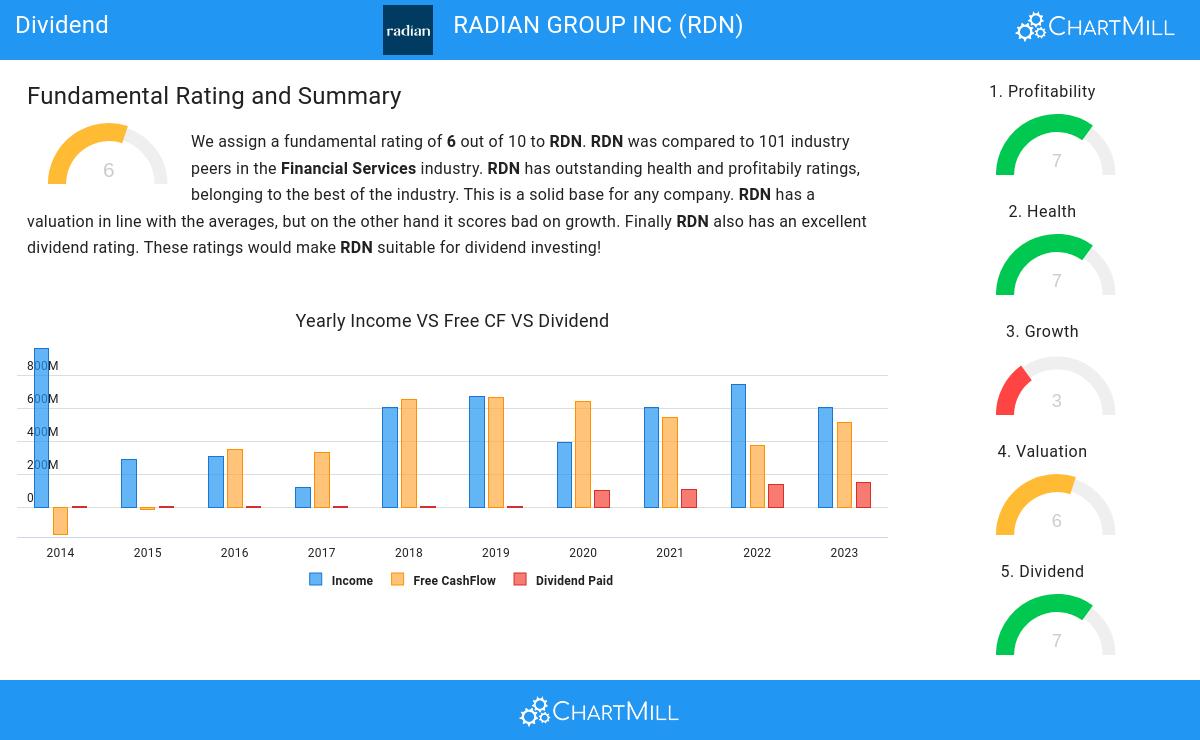
RADIAN GROUP INC (NYSE:RDN) is a hidden gem unveiled by our stock screening tool, featuring a promising dividend outlook alongside solid fundamentals. NYSE:RDN demonstrates decent financial health and profitability while ensuring a sustainable dividend. Let's break it down further.
Unpacking NYSE:RDN's Dividend Rating
ChartMill assigns a Dividend Rating to each stock, ranging from 0 to 10. This rating is calculated by analyzing various dividend elements, such as yield, historical performance, dividend growth, and sustainability. NYSE:RDN has been awarded a 7 for its dividend quality:
- RDN's Dividend Yield is a higher than the industry average which is at 3.60.
- RDN's Dividend Yield is a higher than the S&P500 average which is at 2.22.
- On average, the dividend of RDN grows each year by 149.14%, which is quite nice.
- RDN has been paying a dividend for at least 10 years, so it has a reliable track record.
- RDN has not decreased their dividend for at least 10 years, which is a reliable track record.
- 24.65% of the earnings are spent on dividend by RDN. This is a low number and sustainable payout ratio.
Deciphering NYSE:RDN's Health Rating
ChartMill utilizes a Health Rating to assess stocks, scoring them on a scale of 0 to 10. This rating takes into account a variety of liquidity and solvency ratios, both in absolute terms and in comparison to industry peers. NYSE:RDN has earned a 7 out of 10:
- Looking at the Altman-Z score, with a value of 2.15, RDN is in the better half of the industry, outperforming 76.24% of the companies in the same industry.
- RDN has a Debt/Equity ratio of 0.45. This is a healthy value indicating a solid balance between debt and equity.
- RDN's Debt to Equity ratio of 0.45 is fine compared to the rest of the industry. RDN outperforms 62.38% of its industry peers.
- RDN has a Current Ratio of 3.44. This indicates that RDN is financially healthy and has no problem in meeting its short term obligations.
- Looking at the Current ratio, with a value of 3.44, RDN belongs to the top of the industry, outperforming 86.14% of the companies in the same industry.
- RDN has a Quick Ratio of 3.44. This indicates that RDN is financially healthy and has no problem in meeting its short term obligations.
- RDN has a Quick ratio of 3.44. This is amongst the best in the industry. RDN outperforms 87.13% of its industry peers.
Profitability Analysis for NYSE:RDN
ChartMill's Profitability Rating offers a unique perspective on stock analysis, providing scores from 0 to 10. These ratings consider a wide range of profitability metrics and margins, both in comparison to industry peers and on their own merits. For NYSE:RDN, the assigned 7 is a significant indicator of profitability:
- RDN has a Return On Assets of 7.42%. This is amongst the best in the industry. RDN outperforms 88.12% of its industry peers.
- Looking at the Return On Equity, with a value of 13.46%, RDN is in the better half of the industry, outperforming 62.38% of the companies in the same industry.
- The Return On Invested Capital of RDN (8.67%) is better than 81.19% of its industry peers.
- The Average Return On Invested Capital over the past 3 years for RDN is above the industry average of 7.37%.
- Looking at the Profit Margin, with a value of 47.05%, RDN belongs to the top of the industry, outperforming 91.09% of the companies in the same industry.
- RDN has a better Operating Margin (69.84%) than 93.07% of its industry peers.
- RDN's Operating Margin has improved in the last couple of years.
Our Best Dividend screener lists more Best Dividend stocks and is updated daily.
For an up to date full fundamental analysis you can check the fundamental report of RDN
Disclaimer
This is not investing advice! The article highlights some of the observations at the time of writing, but you should always make your own analysis and invest based on your own insights.