
Exploring NYSE:RDN's dividend characteristics.
By Mill Chart
Last update: Sep 18, 2024
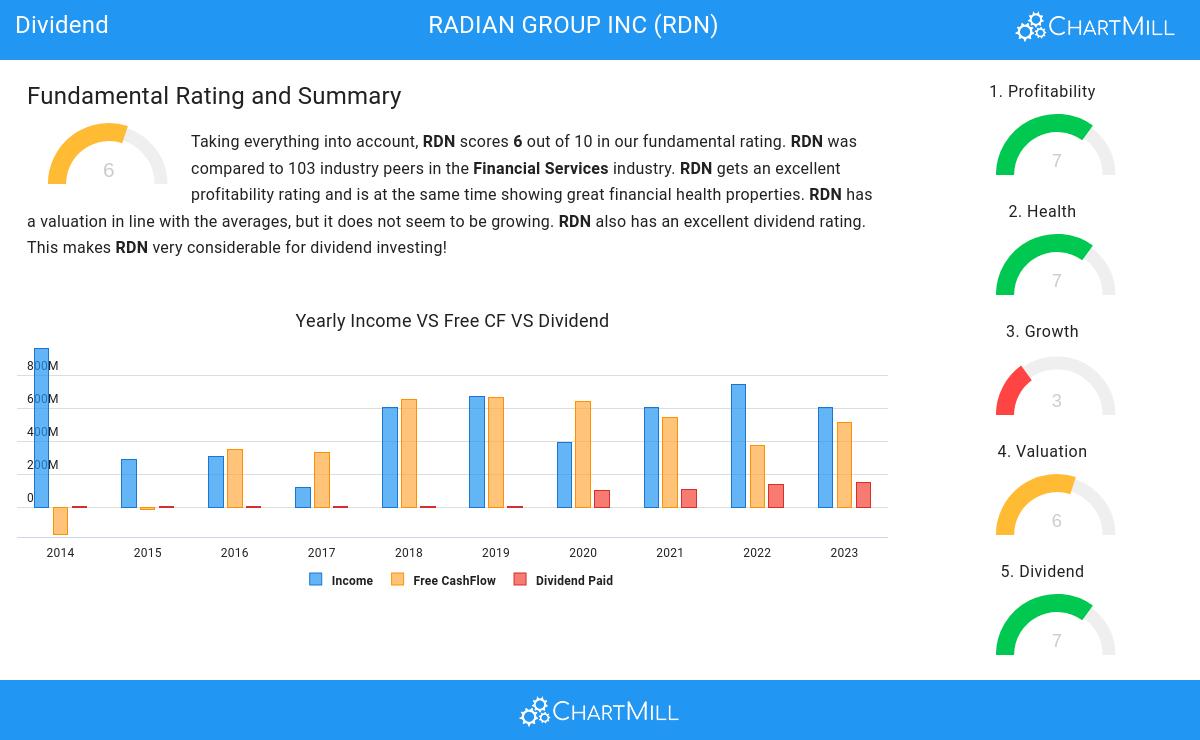
RADIAN GROUP INC (NYSE:RDN) has caught the attention of dividend investors as a stock worth considering. NYSE:RDN excels in profitability, solvency, and liquidity, all while providing a decent dividend. Let's delve into the details.
Deciphering NYSE:RDN's Dividend Rating
An integral part of ChartMill's stock analysis is the Dividend Rating, which spans from 0 to 10. This rating evaluates diverse dividend factors, including yield, historical data, growth, and sustainability. NYSE:RDN has received a 7 out of 10:
- Compared to an average industry Dividend Yield of 3.67, RDN pays a bit more dividend than its industry peers.
- Compared to an average S&P500 Dividend Yield of 2.26, RDN pays a bit more dividend than the S&P500 average.
- On average, the dividend of RDN grows each year by 149.14%, which is quite nice.
- RDN has paid a dividend for at least 10 years, which is a reliable track record.
- RDN has not decreased its dividend for at least 10 years, so it has a reliable track record of non decreasing dividend.
- 24.65% of the earnings are spent on dividend by RDN. This is a low number and sustainable payout ratio.
Looking at the Health
ChartMill employs a unique Health Rating system for all stocks. This rating, ranging from 0 to 10, is determined by analyzing various liquidity and solvency ratios. For NYSE:RDN, the assigned 7 for health provides valuable insights:
- Looking at the Altman-Z score, with a value of 2.18, RDN is in the better half of the industry, outperforming 78.64% of the companies in the same industry.
- RDN has a Debt/Equity ratio of 0.45. This is a healthy value indicating a solid balance between debt and equity.
- Looking at the Debt to Equity ratio, with a value of 0.45, RDN is in the better half of the industry, outperforming 63.11% of the companies in the same industry.
- RDN has a Current Ratio of 3.44. This indicates that RDN is financially healthy and has no problem in meeting its short term obligations.
- RDN has a Current ratio of 3.44. This is amongst the best in the industry. RDN outperforms 86.41% of its industry peers.
- A Quick Ratio of 3.44 indicates that RDN has no problem at all paying its short term obligations.
- The Quick ratio of RDN (3.44) is better than 87.38% of its industry peers.
Understanding NYSE:RDN's Profitability
ChartMill's Profitability Rating offers a unique perspective on stock analysis, providing scores from 0 to 10. These ratings consider a wide range of profitability metrics and margins, both in comparison to industry peers and on their own merits. For NYSE:RDN, the assigned 7 is a significant indicator of profitability:
- Looking at the Return On Assets, with a value of 7.42%, RDN belongs to the top of the industry, outperforming 88.35% of the companies in the same industry.
- RDN's Return On Equity of 13.46% is fine compared to the rest of the industry. RDN outperforms 63.11% of its industry peers.
- RDN has a Return On Invested Capital of 8.67%. This is amongst the best in the industry. RDN outperforms 81.55% of its industry peers.
- Measured over the past 3 years, the Average Return On Invested Capital for RDN is above the industry average of 7.38%.
- Looking at the Profit Margin, with a value of 47.05%, RDN belongs to the top of the industry, outperforming 91.26% of the companies in the same industry.
- Looking at the Operating Margin, with a value of 69.84%, RDN belongs to the top of the industry, outperforming 93.20% of the companies in the same industry.
- RDN's Operating Margin has improved in the last couple of years.
Every day, new Best Dividend stocks can be found on ChartMill in our Best Dividend screener.
Our latest full fundamental report of RDN contains the most current fundamental analsysis.
Disclaimer
This is not investing advice! The article highlights some of the observations at the time of writing, but you should always make your own analysis and invest based on your own insights.