
For those who appreciate value investing, NASDAQ:QFIN is a compelling option with its solid fundamentals.
By Mill Chart
Last update: Oct 7, 2024
Discover QIFU TECHNOLOGY INC (NASDAQ:QFIN), an undervalued stock highlighted by our stock screener. NASDAQ:QFIN showcases solid financial health and profitability while maintaining an appealing valuation. We'll explore the details.
Valuation Analysis for NASDAQ:QFIN
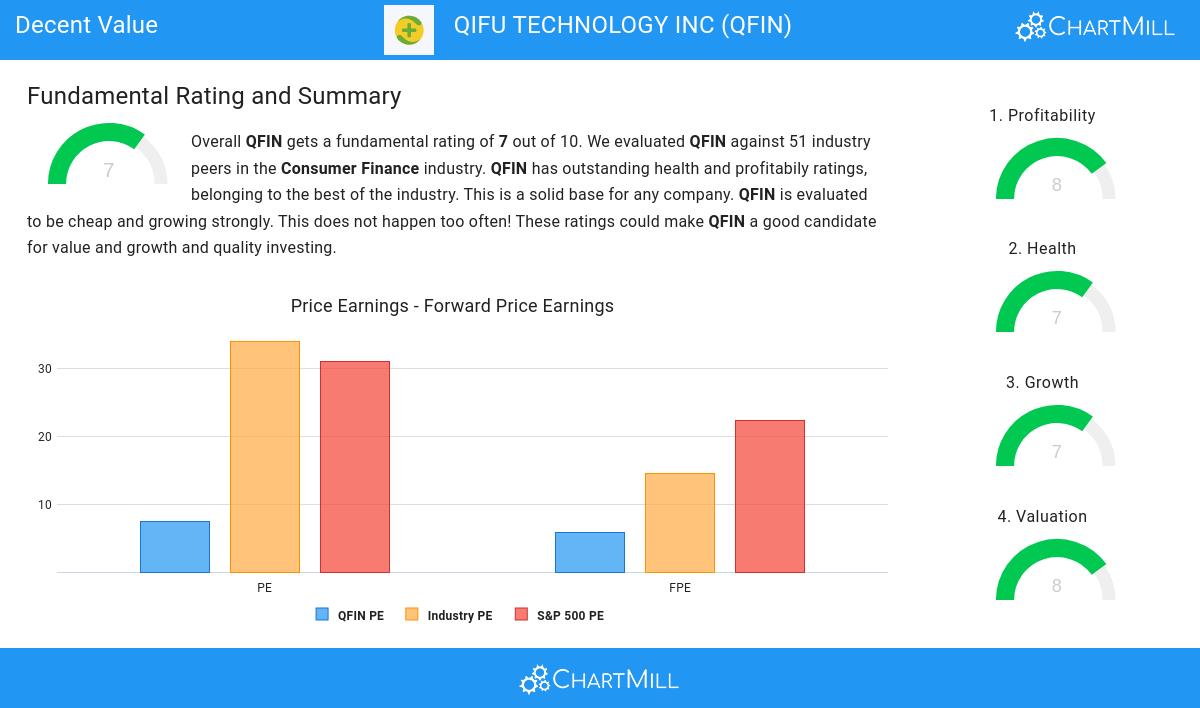
ChartMill assigns a Valuation Rating to each stock, ranging from 0 to 10. This rating is calculated by analyzing different valuation elements, such as price to earnings and free cash flow, both in absolute terms and relative to the market and industry. In the case of NASDAQ:QFIN, the assigned 8 reflects its valuation:
- A Price/Earnings ratio of 7.49 indicates a rather cheap valuation of QFIN.
- Based on the Price/Earnings ratio, QFIN is valued a bit cheaper than 74.51% of the companies in the same industry.
- Compared to an average S&P500 Price/Earnings ratio of 31.01, QFIN is valued rather cheaply.
- A Price/Forward Earnings ratio of 5.80 indicates a rather cheap valuation of QFIN.
- Based on the Price/Forward Earnings ratio, QFIN is valued a bit cheaper than the industry average as 78.43% of the companies are valued more expensively.
- Compared to an average S&P500 Price/Forward Earnings ratio of 22.36, QFIN is valued rather cheaply.
- Based on the Enterprise Value to EBITDA ratio, QFIN is valued cheaply inside the industry as 84.31% of the companies are valued more expensively.
- The low PEG Ratio(NY), which compensates the Price/Earnings for growth, indicates a rather cheap valuation of the company.
- QFIN has an outstanding profitability rating, which may justify a higher PE ratio.
- A more expensive valuation may be justified as QFIN's earnings are expected to grow with 19.12% in the coming years.
Profitability Analysis for NASDAQ:QFIN
ChartMill employs its own Profitability Rating system for stock evaluation. This score, ranging from 0 to 10, is derived from an analysis of diverse profitability metrics and margins. In the case of NASDAQ:QFIN, the assigned 8 is noteworthy for profitability:
- Looking at the Return On Assets, with a value of 10.21%, QFIN belongs to the top of the industry, outperforming 94.12% of the companies in the same industry.
- QFIN has a better Return On Equity (21.26%) than 86.27% of its industry peers.
- The Return On Invested Capital of QFIN (15.97%) is better than 92.16% of its industry peers.
- QFIN had an Average Return On Invested Capital over the past 3 years of 19.66%. This is significantly above the industry average of 7.17%.
- Looking at the Profit Margin, with a value of 28.08%, QFIN belongs to the top of the industry, outperforming 92.16% of the companies in the same industry.
- The Operating Margin of QFIN (35.21%) is better than 96.08% of its industry peers.
- QFIN has a better Gross Margin (83.44%) than 82.35% of its industry peers.
Deciphering NASDAQ:QFIN's Health Rating
ChartMill utilizes a Health Rating to assess stocks, scoring them on a scale of 0 to 10. This rating takes into account a variety of liquidity and solvency ratios, both in absolute terms and in comparison to industry peers. NASDAQ:QFIN has earned a 7 out of 10:
- The Debt to FCF ratio of QFIN is 0.14, which is an excellent value as it means it would take QFIN, only 0.14 years of fcf income to pay off all of its debts.
- QFIN has a Debt to FCF ratio of 0.14. This is amongst the best in the industry. QFIN outperforms 94.12% of its industry peers.
- A Debt/Equity ratio of 0.05 indicates that QFIN is not too dependend on debt financing.
- QFIN has a better Debt to Equity ratio (0.05) than 86.27% of its industry peers.
- A Current Ratio of 2.45 indicates that QFIN has no problem at all paying its short term obligations.
- QFIN has a better Current ratio (2.45) than 76.47% of its industry peers.
- QFIN has a Quick Ratio of 2.45. This indicates that QFIN is financially healthy and has no problem in meeting its short term obligations.
- With a decent Quick ratio value of 2.45, QFIN is doing good in the industry, outperforming 78.43% of the companies in the same industry.
Deciphering NASDAQ:QFIN's Growth Rating
Every stock receives a Growth Rating from ChartMill, ranging from 0 to 10. This rating assesses various growth aspects, including historical and projected EPS and revenue growth. NASDAQ:QFIN boasts a 7 out of 10:
- The Earnings Per Share has grown by an impressive 24.11% over the past year.
- QFIN shows quite a strong growth in Revenue. In the last year, the Revenue has grown by 9.80%.
- Measured over the past years, QFIN shows a very strong growth in Revenue. The Revenue has been growing by 29.65% on average per year.
- Based on estimates for the next years, QFIN will show a quite strong growth in Earnings Per Share. The EPS will grow by 19.12% on average per year.
- Based on estimates for the next years, QFIN will show a quite strong growth in Revenue. The Revenue will grow by 8.18% on average per year.
- When comparing the EPS growth rate of the last years to the growth rate of the upcoming years, we see that the growth is accelerating.
Every day, new Decent Value stocks can be found on ChartMill in our Decent Value screener.
Check the latest full fundamental report of QFIN for a complete fundamental analysis.
Disclaimer
This article should in no way be interpreted as advice. The article is based on the observed metrics at the time of writing, but you should always make your own analysis and trade or invest at your own responsibility.
37.93
+2.44 (+6.88%)
Find more stocks in the Stock Screener
QFIN Latest News and Analysis
 16 days ago - ChartmillWhy Peter Lynch may take an interest in QIFU TECHNOLOGY INC (NASDAQ:QFIN)
Peter Lynch favored companies with strong earnings growth, reasonable valuations, and solid financials. In this analysis, we’ll determine if QIFU TECHNOLOGY INC (NASDAQ:QFIN) qualifies as a true Lynch-style investment.
