
Uncover the potential of QIFU TECHNOLOGY INC (NASDAQ:QFIN), a growth stock that our stock screener found to be reasonably priced. NASDAQ:QFIN is excelling in growth aspects, maintaining a healthy financial position, and still offers an attractive valuation. We'll examine each aspect in detail.
Analyzing Growth Metrics
ChartMill assigns a proprietary Growth Rating to each stock. The score is computed by evaluating various growth aspects, like EPS and revenue growth. We take into account the history as well as the estimated future numbers. NASDAQ:QFIN was assigned a score of 7 for growth:
- QFIN shows a strong growth in Earnings Per Share. In the last year, the EPS has been growing by 24.11%, which is quite impressive.
- Looking at the last year, QFIN shows a quite strong growth in Revenue. The Revenue has grown by 9.80% in the last year.
- The Revenue has been growing by 29.65% on average over the past years. This is a very strong growth!
- QFIN is expected to show quite a strong growth in Earnings Per Share. In the coming years, the EPS will grow by 19.12% yearly.
- Based on estimates for the next years, QFIN will show a quite strong growth in Revenue. The Revenue will grow by 8.18% on average per year.
- The EPS growth rate is accelerating: in the next years the growth will be better than in the last years.
Assessing Valuation for NASDAQ:QFIN
ChartMill employs its own Valuation Rating system for all stocks. This score, ranging from 0 to 10, is determined by evaluating different valuation factors, including price to earnings and free cash flow, both in absolute terms and relative to the market and industry. NASDAQ:QFIN has earned a 8 for valuation:
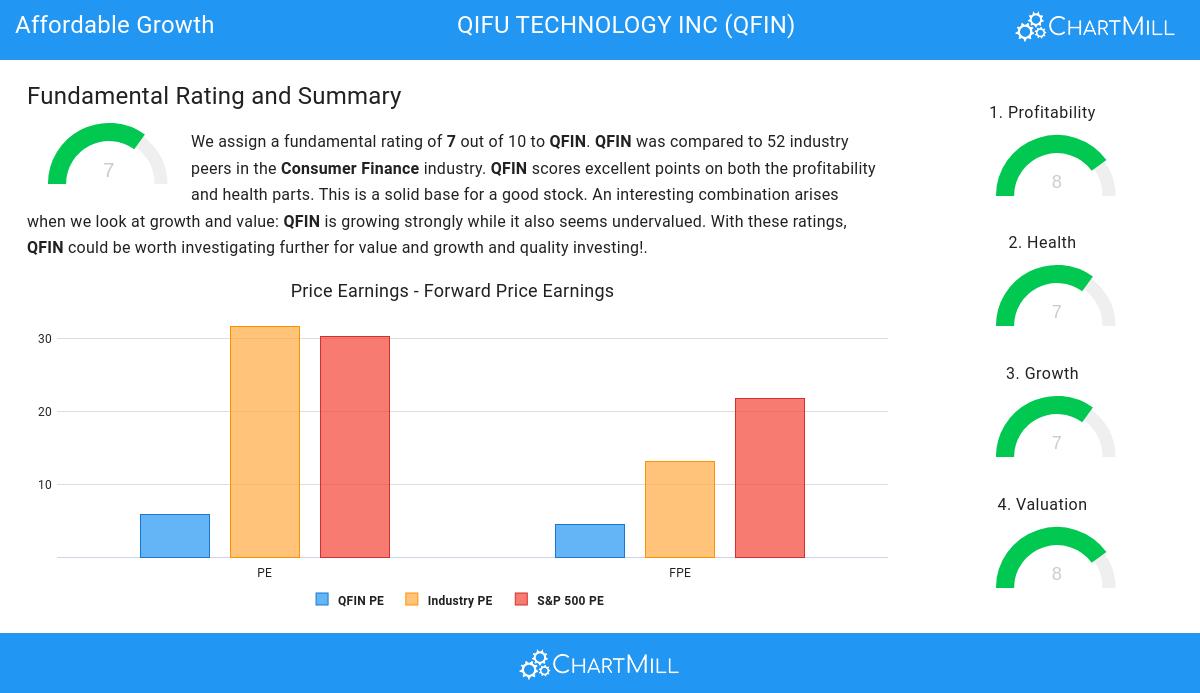
- A Price/Earnings ratio of 5.78 indicates a rather cheap valuation of QFIN.
- Compared to the rest of the industry, the Price/Earnings ratio of QFIN indicates a rather cheap valuation: QFIN is cheaper than 82.69% of the companies listed in the same industry.
- When comparing the Price/Earnings ratio of QFIN to the average of the S&P500 Index (30.15), we can say QFIN is valued rather cheaply.
- QFIN is valuated cheaply with a Price/Forward Earnings ratio of 4.47.
- QFIN's Price/Forward Earnings ratio is rather cheap when compared to the industry. QFIN is cheaper than 86.54% of the companies in the same industry.
- QFIN is valuated cheaply when we compare the Price/Forward Earnings ratio to 21.77, which is the current average of the S&P500 Index.
- Compared to the rest of the industry, the Enterprise Value to EBITDA ratio of QFIN indicates a rather cheap valuation: QFIN is cheaper than 84.62% of the companies listed in the same industry.
- The low PEG Ratio(NY), which compensates the Price/Earnings for growth, indicates a rather cheap valuation of the company.
- QFIN has an outstanding profitability rating, which may justify a higher PE ratio.
- A more expensive valuation may be justified as QFIN's earnings are expected to grow with 19.12% in the coming years.
What does the Health looks like for NASDAQ:QFIN
ChartMill employs its own Health Rating for stock assessment. This rating, ranging from 0 to 10, is calculated by examining various liquidity and solvency ratios. In the case of NASDAQ:QFIN, the assigned 7 reflects its health status:
- The Debt to FCF ratio of QFIN is 0.14, which is an excellent value as it means it would take QFIN, only 0.14 years of fcf income to pay off all of its debts.
- The Debt to FCF ratio of QFIN (0.14) is better than 94.23% of its industry peers.
- QFIN has a Debt/Equity ratio of 0.05. This is a healthy value indicating a solid balance between debt and equity.
- QFIN has a better Debt to Equity ratio (0.05) than 84.62% of its industry peers.
- A Current Ratio of 2.45 indicates that QFIN has no problem at all paying its short term obligations.
- QFIN's Current ratio of 2.45 is fine compared to the rest of the industry. QFIN outperforms 75.00% of its industry peers.
- QFIN has a Quick Ratio of 2.45. This indicates that QFIN is financially healthy and has no problem in meeting its short term obligations.
- QFIN's Quick ratio of 2.45 is fine compared to the rest of the industry. QFIN outperforms 76.92% of its industry peers.
Understanding NASDAQ:QFIN's Profitability
ChartMill utilizes a Profitability Rating to assess stocks, scoring them on a scale of 0 to 10. This rating takes into account a variety of profitability ratios and margins, both in absolute terms and in comparison to industry peers. NASDAQ:QFIN has earned a 8 out of 10:
- Looking at the Return On Assets, with a value of 10.21%, QFIN belongs to the top of the industry, outperforming 94.23% of the companies in the same industry.
- The Return On Equity of QFIN (21.26%) is better than 86.54% of its industry peers.
- The Return On Invested Capital of QFIN (15.97%) is better than 92.31% of its industry peers.
- Measured over the past 3 years, the Average Return On Invested Capital for QFIN is significantly above the industry average of 7.17%.
- With an excellent Profit Margin value of 28.08%, QFIN belongs to the best of the industry, outperforming 92.31% of the companies in the same industry.
- The Operating Margin of QFIN (35.21%) is better than 96.15% of its industry peers.
- QFIN's Gross Margin of 83.44% is amongst the best of the industry. QFIN outperforms 82.69% of its industry peers.
Every day, new Affordable Growth stocks can be found on ChartMill in our Affordable Growth screener.
Our latest full fundamental report of QFIN contains the most current fundamental analsysis.
Disclaimer
This is not investing advice! The article highlights some of the observations at the time of writing, but you should always make your own analysis and invest based on your own insights.