Analyzing NASDAQ:QCOM's Dividend Potential.
By Mill Chart
Last update: Oct 23, 2024
Consider QUALCOMM INC (NASDAQ:QCOM) as a top pick for dividend investors, identified by our stock screening tool. NASDAQ:QCOM shines in terms of profitability, solvency, and liquidity, all while paying a decent dividend. Let's dive deeper into the analysis.
A Closer Look at Dividend for NASDAQ:QCOM
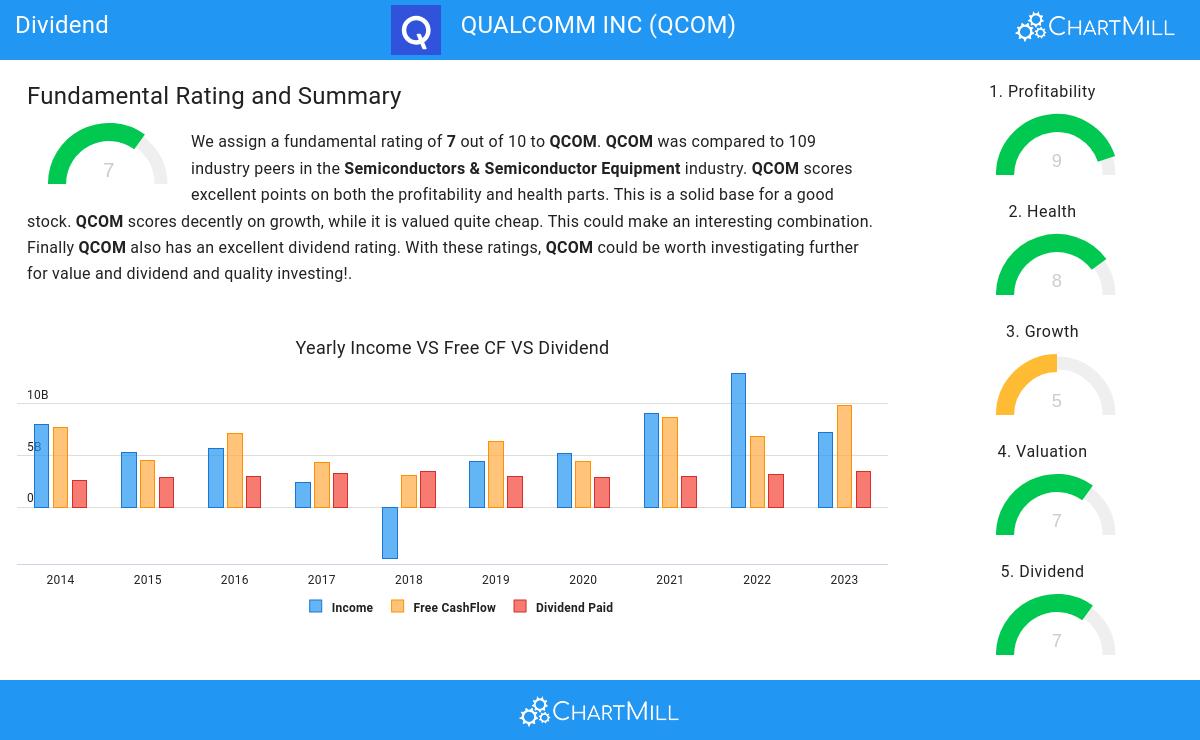
ChartMill provides a Dividend Rating for every stock, ranging from 0 to 10. This rating assesses various dividend aspects, including yield, growth, and sustainability. NASDAQ:QCOM earns a 7 out of 10:
- Compared to an average industry Dividend Yield of 2.25, QCOM pays a better dividend. On top of this QCOM pays more dividend than 89.91% of the companies listed in the same industry.
- QCOM has been paying a dividend for at least 10 years, so it has a reliable track record.
- QCOM has not decreased their dividend for at least 10 years, which is a reliable track record.
- The dividend of QCOM is growing, but earnings are growing more, so the dividend growth is sustainable.
Health Analysis for NASDAQ:QCOM
To gauge a stock's financial health, ChartMill utilizes a Health Rating on a scale of 0 to 10. This comprehensive evaluation encompasses liquidity and solvency, both in absolute terms and in comparison to industry peers. NASDAQ:QCOM has earned a 8 out of 10:
- QCOM has an Altman-Z score of 6.38. This indicates that QCOM is financially healthy and has little risk of bankruptcy at the moment.
- With a decent Altman-Z score value of 6.38, QCOM is doing good in the industry, outperforming 65.14% of the companies in the same industry.
- QCOM has a debt to FCF ratio of 1.16. This is a very positive value and a sign of high solvency as it would only need 1.16 years to pay back of all of its debts.
- Looking at the Debt to FCF ratio, with a value of 1.16, QCOM is in the better half of the industry, outperforming 77.98% of the companies in the same industry.
- Even though the debt/equity ratio score it not favorable for QCOM, it has very limited outstanding debt, so we won't put too much weight on the DE evaluation.
- A Current Ratio of 2.39 indicates that QCOM has no problem at all paying its short term obligations.
- QCOM does not score too well on the current and quick ratio evaluation. However, as it has excellent solvency and profitability, these ratios do not necessarly indicate liquidity issues and need to be evaluated against the specifics of the business.
How do we evaluate the Profitability for NASDAQ:QCOM?
ChartMill assigns a proprietary Profitability Rating to each stock. The score is computed by evaluating various profitability ratios and margins and ranges from 0 to 10. NASDAQ:QCOM was assigned a score of 9 for profitability:
- The Return On Assets of QCOM (16.52%) is better than 88.99% of its industry peers.
- With an excellent Return On Equity value of 35.31%, QCOM belongs to the best of the industry, outperforming 95.41% of the companies in the same industry.
- QCOM has a better Return On Invested Capital (17.50%) than 91.74% of its industry peers.
- QCOM had an Average Return On Invested Capital over the past 3 years of 24.51%. This is significantly above the industry average of 10.66%.
- The 3 year average ROIC (24.51%) for QCOM is well above the current ROIC(17.50%). The reason for the recent decline needs to be investigated.
- QCOM's Profit Margin of 23.33% is amongst the best of the industry. QCOM outperforms 83.49% of its industry peers.
- QCOM's Operating Margin of 25.50% is amongst the best of the industry. QCOM outperforms 84.40% of its industry peers.
- In the last couple of years the Operating Margin of QCOM has grown nicely.
- QCOM's Gross Margin of 55.90% is fine compared to the rest of the industry. QCOM outperforms 77.06% of its industry peers.
Every day, new Best Dividend stocks can be found on ChartMill in our Best Dividend screener.
Our latest full fundamental report of QCOM contains the most current fundamental analsysis.
Disclaimer
Important Note: The content of this article is not intended as trading advice. It is essential to perform your own analysis and exercise caution when making trading decisions. The article presents observations created by automated analysis but does not guarantee any trading or investment outcomes. Always trade responsibly and make independent judgments.
147.21
+6.75 (+4.81%)
Find more stocks in the Stock Screener
QCOM Latest News and Analysis
 2 days ago - ChartmillIs QUALCOMM INC (NASDAQ:QCOM) the type of stock Peter Lynch would love?
Peter Lynch favored companies with strong earnings growth, reasonable valuations, and solid financials. In this analysis, we’ll determine if QUALCOMM INC (NASDAQ:QCOM) qualifies as a true Lynch-style investment.
 10 days ago - ChartmillWhy QUALCOMM INC (NASDAQ:QCOM) qualifies as a good dividend investing stock.
Is QUALCOMM INC (NASDAQ:QCOM) suited for dividend investing?
 16 days ago - ChartmillWhy the quality investor may take a look at QUALCOMM INC (NASDAQ:QCOM).
A fundamental analysis of (NASDAQ:QCOM): Reasonable growth and debt and a high ROIC for QUALCOMM INC (NASDAQ:QCOM).
