
Our stock screener has singled out QUALCOMM INC (NASDAQ:QCOM) as a stellar value proposition. NASDAQ:QCOM not only scores well in profitability, solvency, and liquidity but also maintains a very reasonable price point. We'll explore this further.
Understanding NASDAQ:QCOM's Valuation
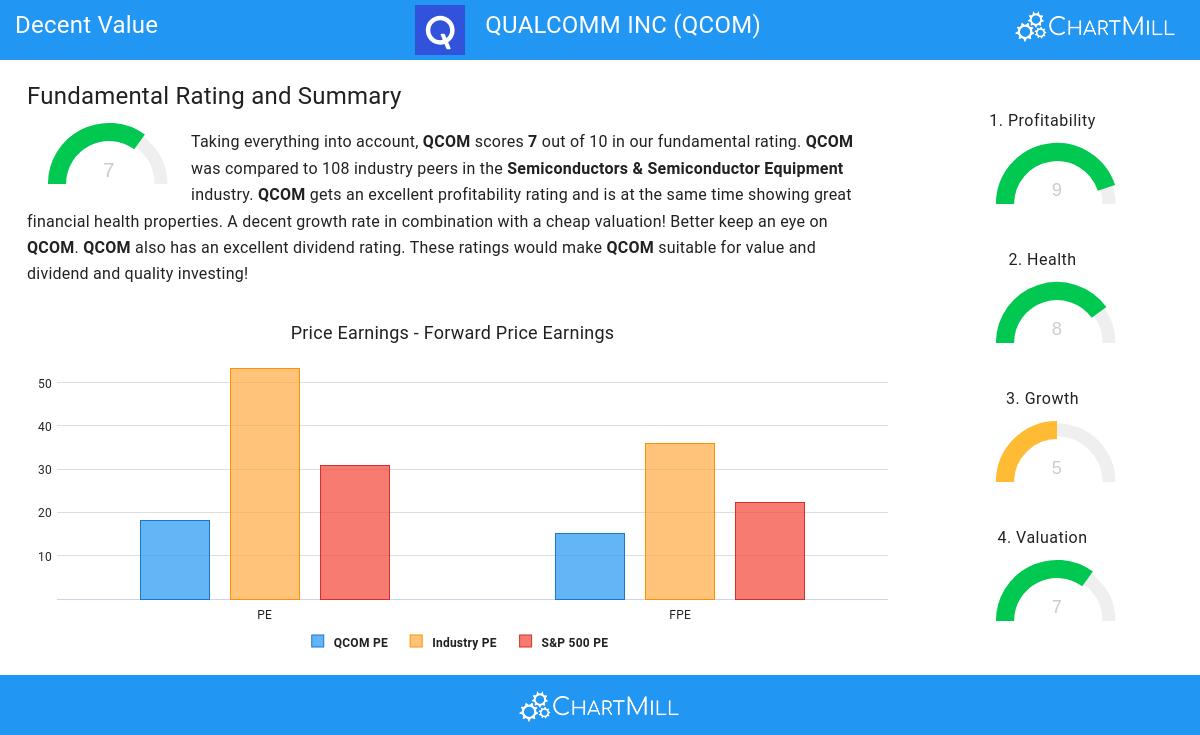
ChartMill provides a Valuation Rating to every stock, ranging from 0 to 10. This rating assesses various valuation aspects, comparing price to earnings and cash flows, while considering factors like profitability and growth. NASDAQ:QCOM boasts a 7 out of 10:
- 85.19% of the companies in the same industry are more expensive than QCOM, based on the Price/Earnings ratio.
- QCOM's Price/Earnings ratio indicates a valuation a bit cheaper than the S&P500 average which is at 30.91.
- 84.26% of the companies in the same industry are more expensive than QCOM, based on the Price/Forward Earnings ratio.
- QCOM's Price/Forward Earnings ratio indicates a valuation a bit cheaper than the S&P500 average which is at 22.30.
- Compared to the rest of the industry, the Enterprise Value to EBITDA ratio of QCOM indicates a somewhat cheap valuation: QCOM is cheaper than 77.78% of the companies listed in the same industry.
- Compared to the rest of the industry, the Price/Free Cash Flow ratio of QCOM indicates a rather cheap valuation: QCOM is cheaper than 91.67% of the companies listed in the same industry.
- QCOM's low PEG Ratio(NY), which compensates the Price/Earnings for growth, indicates a rather cheap valuation of the company.
- The excellent profitability rating of QCOM may justify a higher PE ratio.
- QCOM's earnings are expected to grow with 13.76% in the coming years. This may justify a more expensive valuation.
Understanding NASDAQ:QCOM's Profitability
Discover ChartMill's exclusive Profitability Rating, a proprietary metric that assesses stocks on a scale of 0 to 10. It takes into consideration various profitability ratios and margins, both in absolute terms and relative to industry peers. Notably, NASDAQ:QCOM has achieved a 9:
- Looking at the Return On Assets, with a value of 16.52%, QCOM belongs to the top of the industry, outperforming 88.89% of the companies in the same industry.
- With an excellent Return On Equity value of 35.31%, QCOM belongs to the best of the industry, outperforming 95.37% of the companies in the same industry.
- Looking at the Return On Invested Capital, with a value of 17.50%, QCOM belongs to the top of the industry, outperforming 91.67% of the companies in the same industry.
- The Average Return On Invested Capital over the past 3 years for QCOM is significantly above the industry average of 10.86%.
- The 3 year average ROIC (24.51%) for QCOM is well above the current ROIC(17.50%). The reason for the recent decline needs to be investigated.
- Looking at the Profit Margin, with a value of 23.33%, QCOM belongs to the top of the industry, outperforming 83.33% of the companies in the same industry.
- QCOM's Operating Margin of 25.50% is amongst the best of the industry. QCOM outperforms 84.26% of its industry peers.
- In the last couple of years the Operating Margin of QCOM has grown nicely.
- QCOM's Gross Margin of 55.90% is fine compared to the rest of the industry. QCOM outperforms 76.85% of its industry peers.
Health Insights: NASDAQ:QCOM
Every stock is evaluated by ChartMill, receiving a Health Rating on a scale of 0 to 10. This assessment considers different health aspects, including liquidity and solvency, both in absolute terms and relative to industry peers. NASDAQ:QCOM has achieved a 8 out of 10:
- An Altman-Z score of 6.37 indicates that QCOM is not in any danger for bankruptcy at the moment.
- The Altman-Z score of QCOM (6.37) is better than 64.81% of its industry peers.
- QCOM has a debt to FCF ratio of 1.16. This is a very positive value and a sign of high solvency as it would only need 1.16 years to pay back of all of its debts.
- The Debt to FCF ratio of QCOM (1.16) is better than 76.85% of its industry peers.
- Although QCOM does not score too well on debt/equity it has very limited outstanding debt, which is well covered by the FCF. We will not put too much weight on the debt/equity number as it may be because of low equity, which could be a consequence of a share buyback program for instance. This needs to be investigated.
- QCOM has a Current Ratio of 2.39. This indicates that QCOM is financially healthy and has no problem in meeting its short term obligations.
- The current and quick ratio evaluation for QCOM is rather negative, while it does have excellent solvency and profitability. These ratios do not necessarly indicate liquidity issues and need to be evaluated against the specifics of the business.
Evaluating Growth: NASDAQ:QCOM
Every stock receives a Growth Rating from ChartMill, ranging from 0 to 10. This rating assesses various growth aspects, including historical and projected EPS and revenue growth. NASDAQ:QCOM boasts a 5 out of 10:
- QCOM shows quite a strong growth in Earnings Per Share. Measured over the last years, the EPS has been growing by 19.65% yearly.
- Measured over the past years, QCOM shows a quite strong growth in Revenue. The Revenue has been growing by 9.64% on average per year.
- Based on estimates for the next years, QCOM will show a quite strong growth in Earnings Per Share. The EPS will grow by 10.30% on average per year.
Our Decent Value screener lists more Decent Value stocks and is updated daily.
Check the latest full fundamental report of QCOM for a complete fundamental analysis.
Keep in mind
Important Note: The content of this article is not intended as trading advice. It is essential to perform your own analysis and exercise caution when making trading decisions. The article presents observations created by automated analysis but does not guarantee any trading or investment outcomes. Always trade responsibly and make independent judgments.