
Our stock screener has spotted QUALCOMM INC (NASDAQ:QCOM) as a good dividend stock with solid fundamentals. NASDAQ:QCOM shows decent health and profitability. At the same time it gives a good and sustainable dividend. We'll dive into each aspect below.
Dividend Analysis for NASDAQ:QCOM
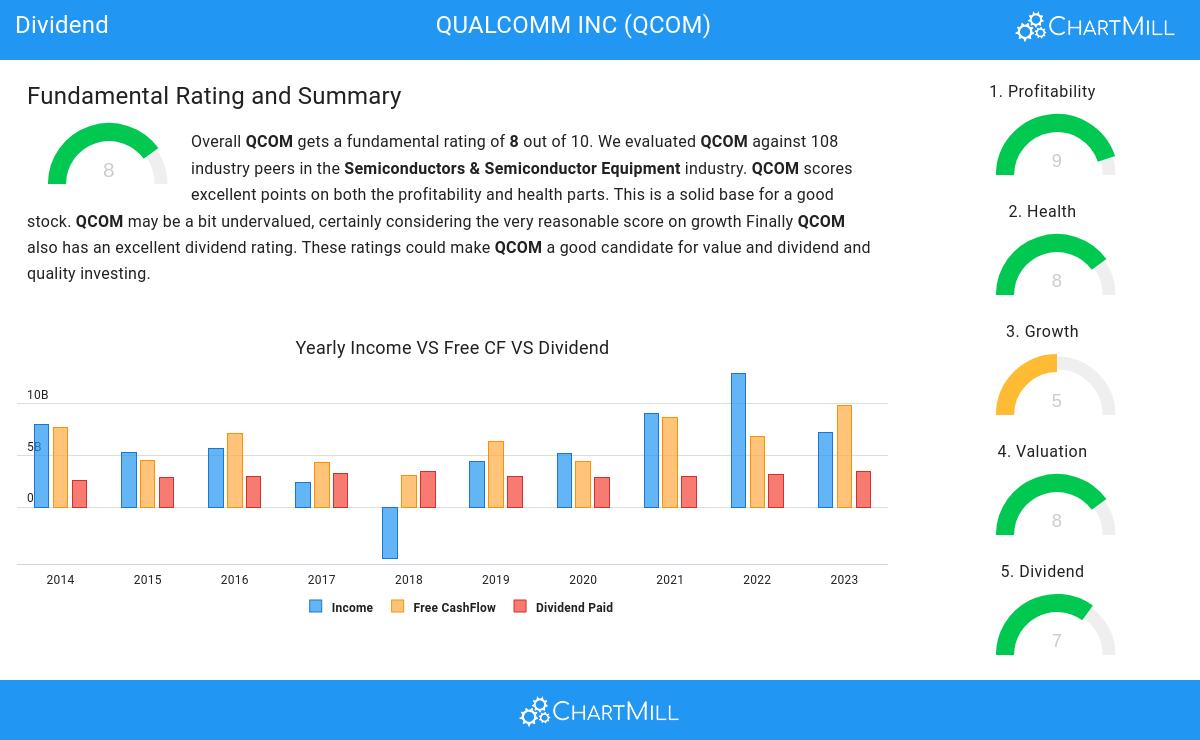
ChartMill assigns a proprietary Dividend Rating to each stock. The score is computed by evaluating various valuation aspects, like the yield, the history, the dividend growth and sustainability. NASDAQ:QCOM was assigned a score of 7 for dividend:
- Compared to an average industry Dividend Yield of 2.37, QCOM pays a better dividend. On top of this QCOM pays more dividend than 89.81% of the companies listed in the same industry.
- QCOM has been paying a dividend for at least 10 years, so it has a reliable track record.
- QCOM has not decreased its dividend for at least 10 years, so it has a reliable track record of non decreasing dividend.
- The dividend of QCOM is growing, but earnings are growing more, so the dividend growth is sustainable.
Unpacking NASDAQ:QCOM's Health Rating
ChartMill assigns a proprietary Health Rating to each stock. The score is computed by evaluating various liquidity and solvency ratios and ranges from 0 to 10. NASDAQ:QCOM was assigned a score of 8 for health:
- QCOM has an Altman-Z score of 6.02. This indicates that QCOM is financially healthy and has little risk of bankruptcy at the moment.
- With a decent Altman-Z score value of 6.02, QCOM is doing good in the industry, outperforming 65.74% of the companies in the same industry.
- QCOM has a debt to FCF ratio of 1.16. This is a very positive value and a sign of high solvency as it would only need 1.16 years to pay back of all of its debts.
- QCOM has a better Debt to FCF ratio (1.16) than 75.93% of its industry peers.
- Even though the debt/equity ratio score it not favorable for QCOM, it has very limited outstanding debt, so we won't put too much weight on the DE evaluation.
- A Current Ratio of 2.39 indicates that QCOM has no problem at all paying its short term obligations.
- The current and quick ratio evaluation for QCOM is rather negative, while it does have excellent solvency and profitability. These ratios do not necessarly indicate liquidity issues and need to be evaluated against the specifics of the business.
Understanding NASDAQ:QCOM's Profitability
Discover ChartMill's exclusive Profitability Rating, a proprietary metric that assesses stocks on a scale of 0 to 10. It takes into consideration various profitability ratios and margins, both in absolute terms and relative to industry peers. Notably, NASDAQ:QCOM has achieved a 9:
- Looking at the Return On Assets, with a value of 16.52%, QCOM belongs to the top of the industry, outperforming 88.89% of the companies in the same industry.
- QCOM has a better Return On Equity (35.31%) than 95.37% of its industry peers.
- With an excellent Return On Invested Capital value of 17.50%, QCOM belongs to the best of the industry, outperforming 91.67% of the companies in the same industry.
- The Average Return On Invested Capital over the past 3 years for QCOM is significantly above the industry average of 10.67%.
- The 3 year average ROIC (24.51%) for QCOM is well above the current ROIC(17.50%). The reason for the recent decline needs to be investigated.
- With an excellent Profit Margin value of 23.33%, QCOM belongs to the best of the industry, outperforming 83.33% of the companies in the same industry.
- The Operating Margin of QCOM (25.50%) is better than 84.26% of its industry peers.
- QCOM's Operating Margin has improved in the last couple of years.
- QCOM has a better Gross Margin (55.90%) than 76.85% of its industry peers.
Our Best Dividend screener lists more Best Dividend stocks and is updated daily.
Check the latest full fundamental report of QCOM for a complete fundamental analysis.
Keep in mind
Important Note: The content of this article is not intended as trading advice. It is essential to perform your own analysis and exercise caution when making trading decisions. The article presents observations created by automated analysis but does not guarantee any trading or investment outcomes. Always trade responsibly and make independent judgments.