
Our stock screener has spotted QUALCOMM INC (NASDAQ:QCOM) as an undervalued stock with solid fundamentals. NASDAQ:QCOM shows decent health and profitability. At the same time it remains remains attractively priced. We'll dive into each aspect below.
Evaluating Valuation: NASDAQ:QCOM
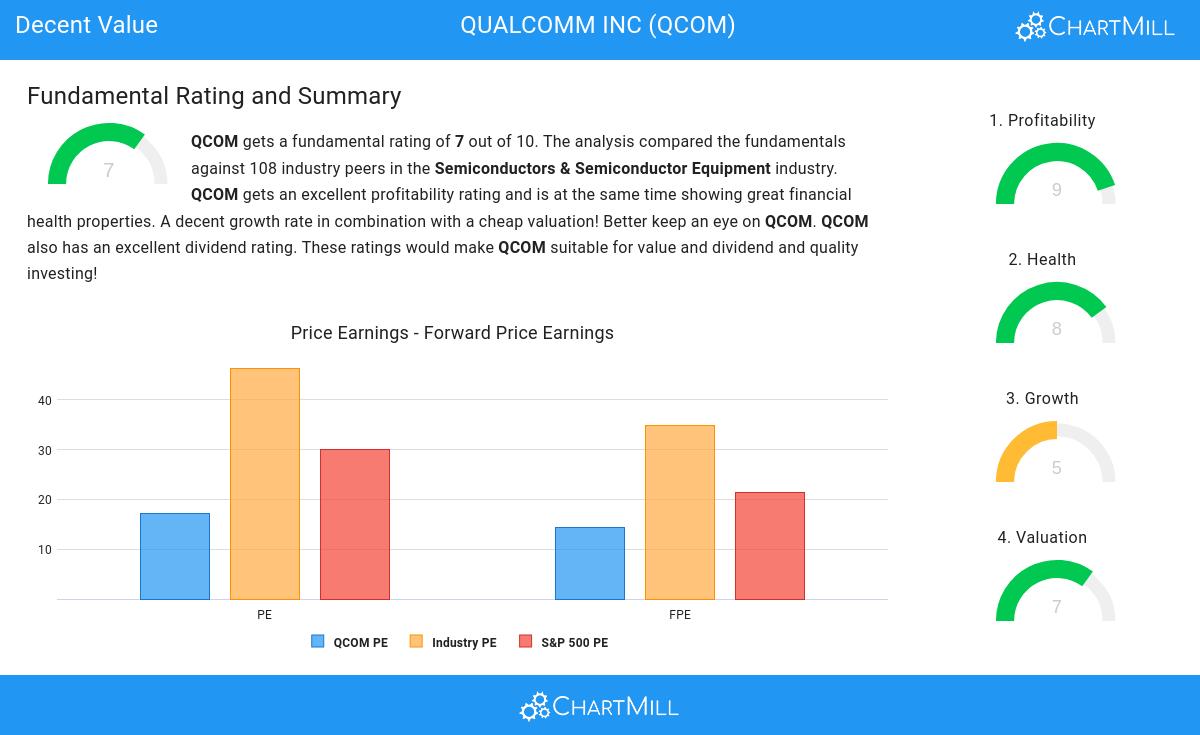
ChartMill assigns a proprietary Valuation Rating to each stock. The score is computed by evaluating various valuation aspects, like price to earnings and free cash flow, both absolutely as relative to the market and industry. NASDAQ:QCOM was assigned a score of 7 for valuation:
- Based on the Price/Earnings ratio, QCOM is valued cheaply inside the industry as 85.19% of the companies are valued more expensively.
- When comparing the Price/Earnings ratio of QCOM to the average of the S&P500 Index (29.93), we can say QCOM is valued slightly cheaper.
- Based on the Price/Forward Earnings ratio, QCOM is valued cheaply inside the industry as 83.33% of the companies are valued more expensively.
- Compared to an average S&P500 Price/Forward Earnings ratio of 21.45, QCOM is valued a bit cheaper.
- Based on the Enterprise Value to EBITDA ratio, QCOM is valued a bit cheaper than the industry average as 78.70% of the companies are valued more expensively.
- Based on the Price/Free Cash Flow ratio, QCOM is valued cheaply inside the industry as 90.74% of the companies are valued more expensively.
- QCOM's low PEG Ratio(NY), which compensates the Price/Earnings for growth, indicates a rather cheap valuation of the company.
- QCOM has an outstanding profitability rating, which may justify a higher PE ratio.
- A more expensive valuation may be justified as QCOM's earnings are expected to grow with 13.66% in the coming years.
Evaluating Profitability: NASDAQ:QCOM
ChartMill employs its own Profitability Rating system for stock evaluation. This score, ranging from 0 to 10, is derived from an analysis of diverse profitability metrics and margins. In the case of NASDAQ:QCOM, the assigned 9 is noteworthy for profitability:
- Looking at the Return On Assets, with a value of 16.52%, QCOM belongs to the top of the industry, outperforming 88.89% of the companies in the same industry.
- QCOM's Return On Equity of 35.31% is amongst the best of the industry. QCOM outperforms 94.44% of its industry peers.
- With an excellent Return On Invested Capital value of 17.50%, QCOM belongs to the best of the industry, outperforming 91.67% of the companies in the same industry.
- QCOM had an Average Return On Invested Capital over the past 3 years of 24.51%. This is significantly above the industry average of 10.76%.
- The 3 year average ROIC (24.51%) for QCOM is well above the current ROIC(17.50%). The reason for the recent decline needs to be investigated.
- QCOM has a better Profit Margin (23.33%) than 82.41% of its industry peers.
- QCOM has a better Operating Margin (25.50%) than 83.33% of its industry peers.
- In the last couple of years the Operating Margin of QCOM has grown nicely.
- The Gross Margin of QCOM (55.90%) is better than 76.85% of its industry peers.
How do we evaluate the Health for NASDAQ:QCOM?
ChartMill assigns a proprietary Health Rating to each stock. The score is computed by evaluating various liquidity and solvency ratios and ranges from 0 to 10. NASDAQ:QCOM was assigned a score of 8 for health:
- QCOM has an Altman-Z score of 6.17. This indicates that QCOM is financially healthy and has little risk of bankruptcy at the moment.
- QCOM has a Altman-Z score of 6.17. This is in the better half of the industry: QCOM outperforms 65.74% of its industry peers.
- QCOM has a debt to FCF ratio of 1.16. This is a very positive value and a sign of high solvency as it would only need 1.16 years to pay back of all of its debts.
- QCOM has a Debt to FCF ratio of 1.16. This is in the better half of the industry: QCOM outperforms 75.00% of its industry peers.
- Although QCOM does not score too well on debt/equity it has very limited outstanding debt, which is well covered by the FCF. We will not put too much weight on the debt/equity number as it may be because of low equity, which could be a consequence of a share buyback program for instance. This needs to be investigated.
- A Current Ratio of 2.39 indicates that QCOM has no problem at all paying its short term obligations.
- The current and quick ratio evaluation for QCOM is rather negative, while it does have excellent solvency and profitability. These ratios do not necessarly indicate liquidity issues and need to be evaluated against the specifics of the business.
ChartMill's Evaluation of Growth
ChartMill employs its own Growth Rating system for all stocks. This score, ranging from 0 to 10, is derived by evaluating different growth factors, such as EPS and revenue growth, taking into account both past performance and future projections. NASDAQ:QCOM has earned a 5 for growth:
- Measured over the past years, QCOM shows a quite strong growth in Earnings Per Share. The EPS has been growing by 19.65% on average per year.
- QCOM shows quite a strong growth in Revenue. Measured over the last years, the Revenue has been growing by 9.64% yearly.
- Based on estimates for the next years, QCOM will show a quite strong growth in Earnings Per Share. The EPS will grow by 10.30% on average per year.
Our Decent Value screener lists more Decent Value stocks and is updated daily.
For an up to date full fundamental analysis you can check the fundamental report of QCOM
Keep in mind
This is not investing advice! The article highlights some of the observations at the time of writing, but you should always make your own analysis and invest based on your own insights.